. 2025 Jul 18:16:1607098.
doi: 10.3389/fimmu.2025.1607098. eCollection 2025.

Exploring of bladder cancer immune-related genes and potential therapeutic targets based on transcriptomic data and Mendelian randomization analysis

Affiliations

Exploring of bladder cancer immune-related genes and potential therapeutic targets based on transcriptomic data and Mendelian randomization analysis

Zhangxiao Xu et al. Front Immunol. .

Abstract

Background: Despite advancements in clinical treatment modalities, immune-related molecular mechanisms underlying bladder cancer remain unclear. Therefore, this study aimed to identify immune-related biomarkers and potential therapeutic targets for bladder cancer, thereby contributing to the development of novel therapeutic interventions.

Methods: By integrating data from The Cancer Genome Atlas (TCGA), Gene Expression Omnibus (GEO), and genome-wide association study (GWAS) databases, combined with differential expression analysis, weighted gene co-expression network analysis (WGCNA), and Mendelian randomization analysis, key immune-related genes in bladder cancer were identified. The correlation between these key genes and immune cell infiltration was also analyzed. The diagnostic efficacy of the key genes was evaluated using Receiver Operating Characteristic (ROC) curves and validated using independent public datasets. Finally, Quantitative real-time polymerase chain reaction (qRT-PCR) was performed to confirm the potential value of these molecular markers in bladder cancer.

Results: Differential expression analysis revealed 2,033 bladder cancer-related genes. WGCNA identified 1,391 immune-related genes and Mendelian randomization analysis identified 187 candidate genes with causal relationships. Eight significantly downregulated genes were identified: LIMS2, TP53INP2, IRAK3, STX2, CYP27A1, IL11RA, KCNMB1, and PDLM7. These genes were significantly associated with immune cell infiltration and exhibited good diagnostic efficacy, as demonstrated by ROC curve analysis and validated in independent public datasets. Furthermore, qRT-PCR experiments showed that LIMS2, IRAK3, STX2, IL11RA, KCNMB1, and PDLM7 were significantly downregulated in the tumor group, consistent with the bioinformatic analysis results, suggesting their potential clinical value.

Conclusion: This study identified six immunoregulatory genes that were significantly negatively associated with bladder cancer risk. These genes may serve not only as potential biomarkers for bladder cancer immunity but also contribute to a deeper understanding of the molecular mechanisms of bladder cancer.

Keywords: CIBERSORT; Mendelian randomization analysis; WGCNA; biomarkers; bladder cancer; potential therapeutic targets.


Conflict of interest statement

The authors declare that this research was conducted in the absence of any commercial or financial relationships that could be construed as potential conflict of interest.

Figures
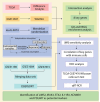
Figure 1
Figure 1
Schematic presentation of the analysis process.
Figure 2
Figure 2
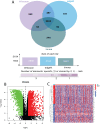
Identification of Differentially Expressed Genes (DEGs) in Bladder Cancer using Wilcoxon, edgeR, and limma Tests. (A) Venn diagram illustrating the overlap of DEGs identified by Wilcoxon rank-sum test, edgeR, and limma analysis in bladder cancer. (B) Volcano plot depicting bladder cancer DEGs and sample hierarchical clustering. (C) Heatmap of the top 30 up- and down-regulated DEGs.
Figure 3
Figure 3
Identification of Modules Associated with Infiltrating Immune Cells using Weighted Gene Co-expression Network Analysis (WGCNA). (A) Sample clustering dendrogram. (B) Analysis of scale-free topology and mean connectivity for various soft-thresholding powers. (C) Dendrogram of all differentially expressed genes based on 1-Topological Overlap Matrix (TOM) dissimilarity measure. The color bands represent the results from dynamic tree cut analysis. (D) Heatmap showing the correlation between module eigengenes and infiltrating immune cell characteristics. The MEpurple module was selected for further analysis. TOM, topological overlap matrix; ME, module eigengene.
Figure 4
Figure 4
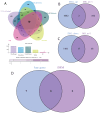
Selection of Key Genes in Bladder Cancer. (A) Venn diagram showing the overlap of 187 causally associated genes, 2033 differentially expressed genes (DEGs), and 1391 immune-related genes in bladder cancer. (B) Venn diagram showing the overlap between bladder cancer upregulated genes and genes with odds ratios (OR) > 1 from Mendelian randomization analysis. (C) Venn diagram showing the overlap between bladder cancer downregulated genes and genes with odds ratios (OR) < 1 from Mendelian randomization analysis. (D) Venn diagram showing the overlap between genes identified by Mendelian randomization causal analysis and immune-related genes in bladder cancer.
Figure 5
Figure 5
Forest plot of Mendelian randomization results for key gene.
Figure 6
Figure 6
Forest plot of genes causally associated with bladder cancer. (A-H) MR effect size of key genes on bladder cancer; (A) LIMS2; (B) TP53INP2; (C) IRAK3; (D) STX2; (E) CYP27A1; (F) IL11RA; (G); (H) PDLIM7.
Figure 7
Figure 7
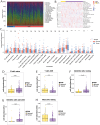
Immune cell infiltration landscape in bladder cancer. (A) Bar chart showing the distribution of 22 immune cell types in each sample. (B) Heatmap showing the expression of 22 immune cell types in bladder cancer and normal samples. (C) Box plot showing the expression of 22 immune cell types in bladder cancer and normal samples. (D-H) Box plots showing the differential infiltration landscape of six immune cell types in bladder cancer and normal samples: (D) Naive B cells; (E) CD8+ T cells; (F) Resting dendritic cells; (G) Activated dendritic cells; (H) Resting mast cells. Each p-value is shown above the corresponding box plot (NS: p > 0.05; *: p ≤ 0.05; **: p ≤ 0.01;****:p ≤ 0.0001).
Figure 8
Figure 8
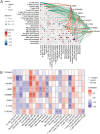
(A, B): These figures present heatmaps illustrating the correlation analysis between 22 immune cell types and the eight key genes. Figure 9A likely shows correlations between the immune cells themselves, and Figure 9B likely shows the correlations between the immune cells and the eight key genes, providing a visual representation of the described relationships.
Figure 9
Figure 9
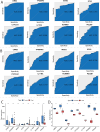
ROC curves for key genes. (A) Receiver Operating Characteristic (ROC) curves of hub genes in the TCGA; (B) ROC curves of hub genes in the GSE13507; (C) TCGA Characterized Gene Intersection Single Gene Expression Boxplot; (D) GSE7476 Characterized Gene Intersection Single Gene Expression Boxplot. Each p-value is shown above the corresponding box plot (NS: p > 0.05; *: p ≤ 0.05; **: p ≤ 0.01; ***: p ≤ 0.001).
Figure 10
Figure 10
Bar graphs showing qRT-PCR expression and differential analysis of key genes. (A-F) Bar graphs showing differential expression analysis of eight key genes (A) LIMS2; (B) IRAK3; (C) STX2; (D) IL11RA; (E) KCNMB1; and (F) PDLIM7 in bladder normal cell line SV and bladder cancer cell lines 5637, T24, and HT1376. Differences between groups were assessed using the Wilcoxon rank-sum test. Each p-value is shown above the corresponding bar (NS: P > 0.05; *: P ≤ 0.05; **: P ≤ 0.01; ***: P ≤ 0.001).

Similar articles

References

    1. Van Hoogstraten LMC, Vrieling A, van der Heijden AG, Kogevinas M, Richters A, Kiemeney LA. Global trends in the epidemiology of bladder cancer: challenges for public health and clinical practice. Nat Rev Clin Oncol. (2023) 20:287–304. doi: 10.1038/s41571-023-00744-3, PMID: - DOI - PubMed
    1. Sung H, Ferlay J, Siegel RL, Laversanne M, Soerjomataram I, Jemal A, et al. Global cancer statistics 2020: GLOBOCAN estimates of incidence and mortality worldwide for 36 cancers in 185 countries. CA A Cancer J Clin. (2021) 71:209–49. doi: 10.3322/caac.21660, PMID: - DOI - PubMed
    1. Babjuk M, Burger M, Capoun O, Cohen D, Compérat EM, Dominguez Escrig JL, et al. European association of urology guidelines on non–muscle-invasive bladder cancer (Ta, T1, and carcinoma in situ). Eur Urol. (2022) 81:75–94. doi: 10.1016/j.eururo.2021.08.010, PMID: - DOI - PubMed
    1. Sanli O, Dobruch J, Knowles MA, Burger M, Alemozaffar M, Nielsen ME, et al. Bladder cancer. Nat Rev Dis Primers. (2017) 3:17022. doi: 10.1038/nrdp.2017.22, PMID: - DOI - PubMed
    1. Humphrey PA, Moch H, Cubilla AL, Ulbright TM, Reuter VE. The 2016 WHO classification of tumours of the urinary system and male genital organs—Part B: prostate and bladder tumours. Eur Urol. (2016) 70:106–19. doi: 10.1016/j.eururo.2016.02.028, PMID: - DOI - PubMed

MeSH terms

Substances

LinkOut - more resources