. 2025 Jul 18:16:1560723.
doi: 10.3389/fimmu.2025.1560723. eCollection 2025.

A multidimensional analysis of temporomandibular joint and ankle joint erosion in inflammatory arthritis

Affiliations

A multidimensional analysis of temporomandibular joint and ankle joint erosion in inflammatory arthritis

Darja Andreev et al. Front Immunol. .

Abstract

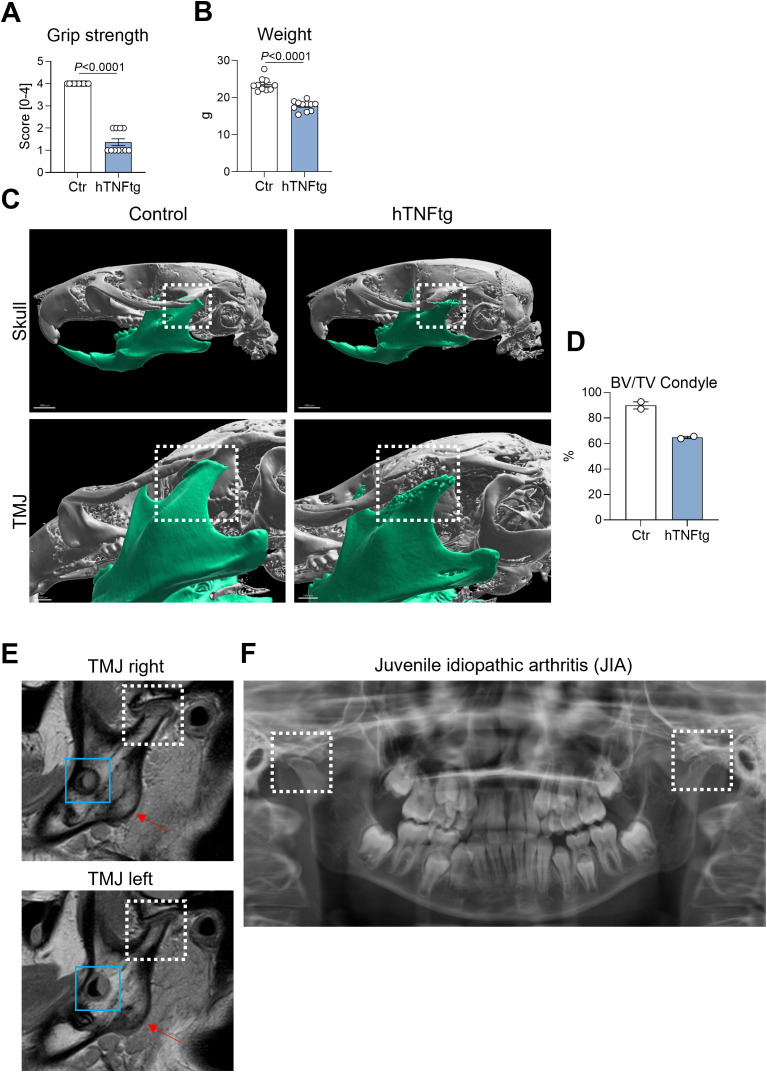
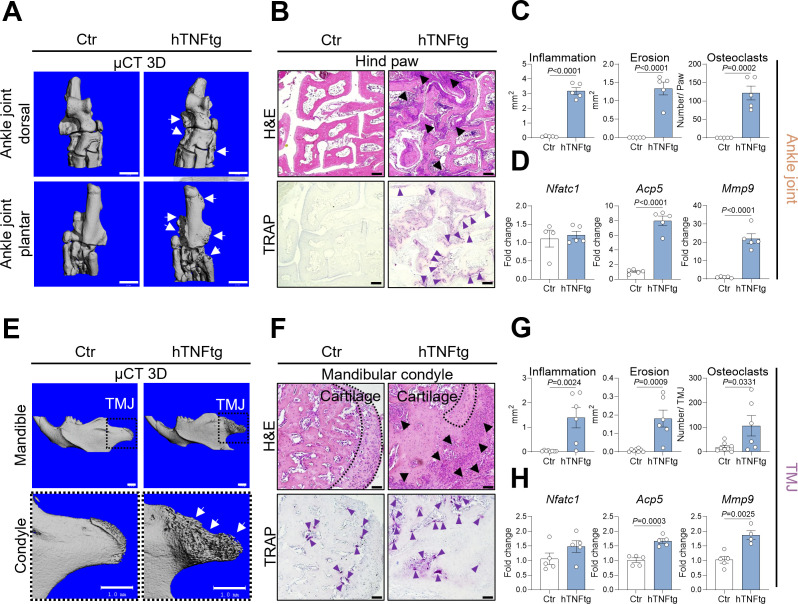
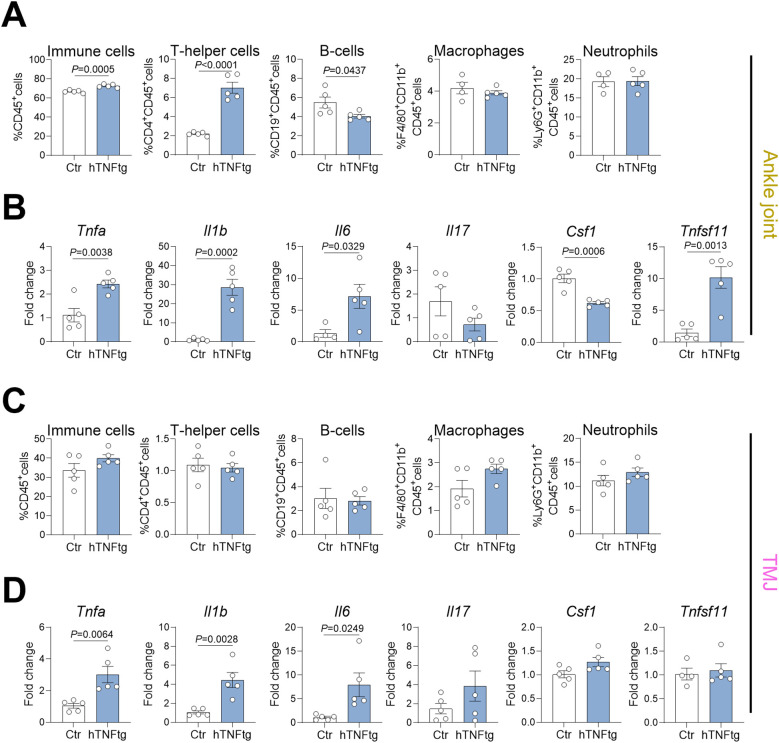
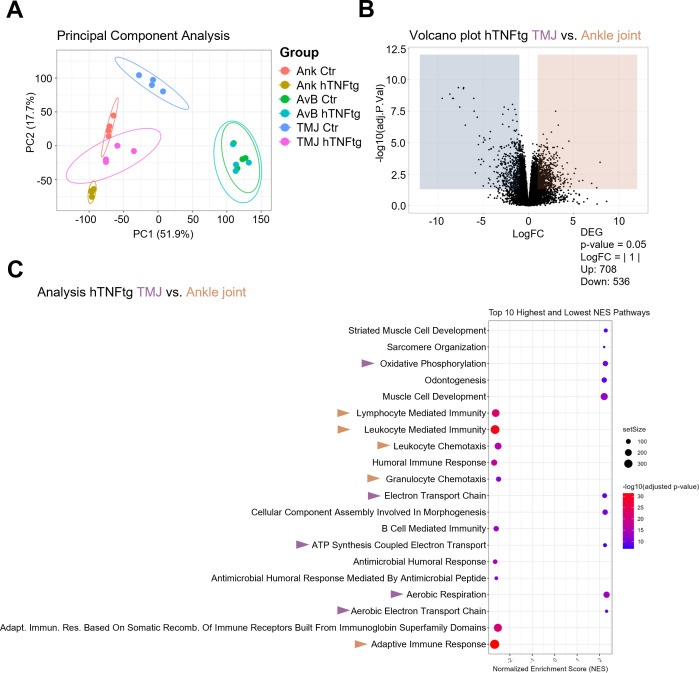
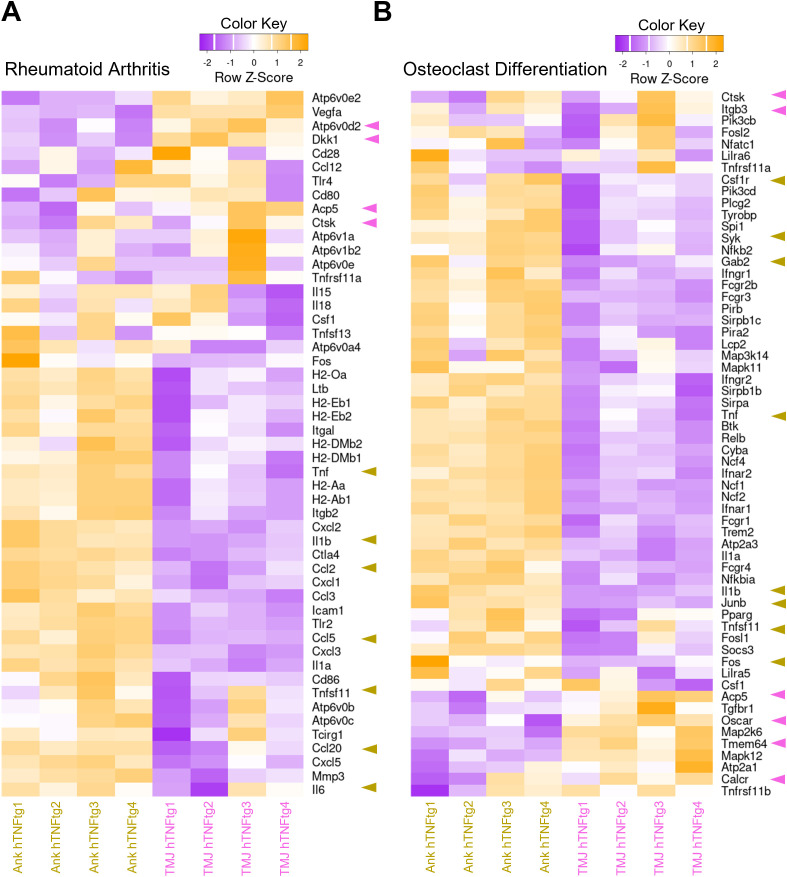
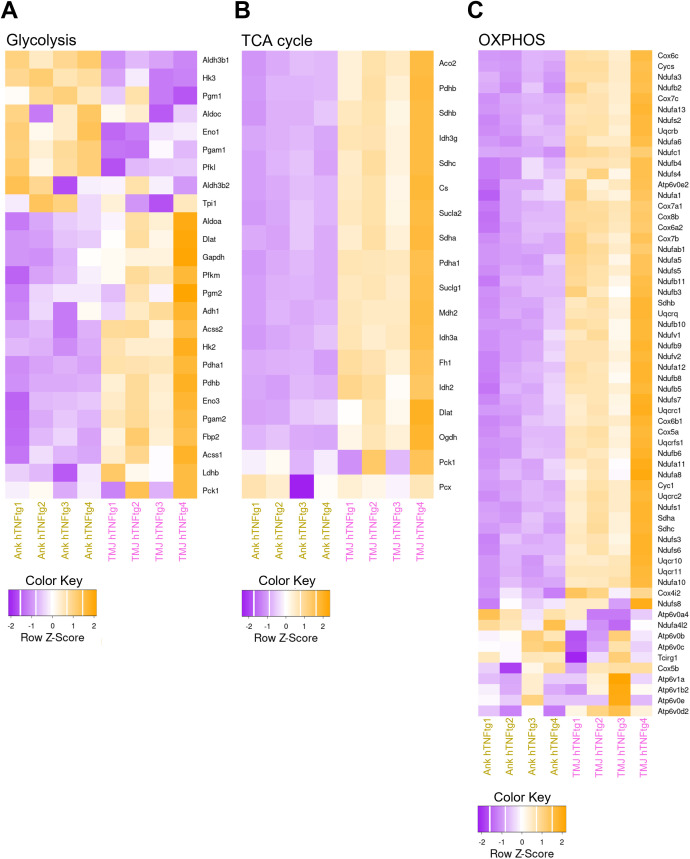
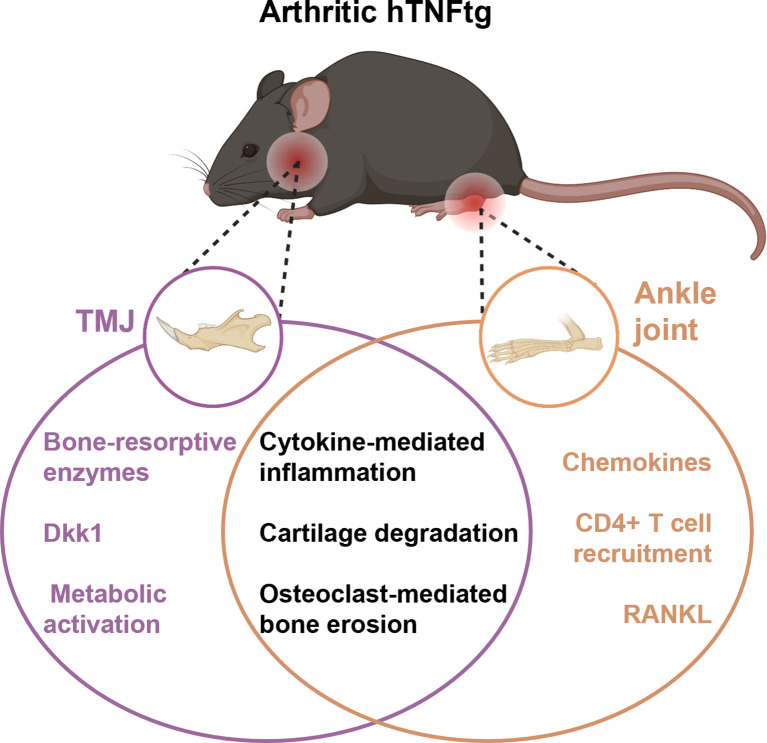
Rheumatoid arthritis (RA) and other inflammatory arthritis are systemic diseases that primarily affect the joints, characterized by synovial inflammation and progressive cartilage and bone degradation. The temporomandibular joint (TMJ) is reported to be involved in over 50% of RA cases, often leading to severe jaw pain and compromised oral function. Despite its prevalence, TMJ involvement is often underestimated, and its cellular and molecular mechanisms remain poorly understood. Due to the unique biological and functional properties of the TMJ, inflammatory pathways observed in other joints such as the well-studied ankle joint may not directly apply to the TMJ. This study aimed to establish a reliable inflammatory arthritis model for investigating TMJ-specific pathomechanisms. The human TNF-α transgenic (hTNFtg) mouse model effectively replicated TMJ pathology seen in arthritic patients, including increased synovial inflammation (p=0.0024) and severe bone loss (p=0.009) as compared to control mice assessed by micro-computed tomography and histomorphometry. These changes were driven by increased osteoclast numbers (p=0.0331) and upregulation of genes associated with bone resorption such as Acp5 (p=0.0003) and Ctsk (p=0.0025). Notably, we observed that the TMJ displays a unique pattern of immune cell infiltration and pro-inflammatory cytokine expression compared to the ankle joint, particularly with respect to T cell recruitment. These findings were further supported by bulk RNA sequencing, which revealed overall increased inflammation in both the ankle joint and TMJ of hTNFtg mice compared to the control group. Interestingly, while the expression of immune cell and pro-inflammatory cytokine-related gene sets was higher in the ankle joint, the TMJ showed increased expression of genes associated with energy consumption and bone resorption-related enzymes. These findings highlight the TMJ as a distinct anatomical site with heightened susceptibility to arthritis-related damage and emphasize the need for greater awareness and targeted research to improve disease management for affected individuals.

Keywords: bone erosion; human TNF-α transgenic mice; inflammatory arthritis; juvenile idiopathic arthritis temporomandibular joint; osteoclasts; rheumatoid arthritis; temporomandibular disorder.


Conflict of interest statement

The authors declare that the research was conducted in the absence of any commercial or financial relationships that could be construed as a potential conflict of interest.

Figures

Figure 1
Figure 1
The hTNFtg arthritis mouse model demonstrates TMJ involvement with characteristics resembling those observed in arthritic patients. (A) Arthritis severity in hTNFtg mice was assessed in comparison to littermate controls using grip strength measurements (n=10-11). (B) Arthritis severity in hTNFtg mice was evaluated relative to littermate controls based on weight loss (n=10-11). (C) Micro-computed tomography (μCT) images of the skull illustrate comparisons between hTNFtg mice and littermate controls. The scale bar represents 2 mm in the upper images and 1 mm in the lower images. (D) Bone volume per total volume (BV/TV) of the mandibular condyle was analyzed in hTNFtg mice versus littermate controls by μCT (n=2). (E) Representative magnetic resonance images (MRI) of a 14-year-old patient diagnosed with juvenile idiopathic arthritis (JIA). Anatomical landmarks are highlighted for orientation: white dashed rectangle—condylar flattening with pronounced bone erosion and cartilage loss due to inflammation and osteochondylar resorption of the right and left temporomandibular joint (TMJ); blue rectangle—developing third molars (teeth 38 and 48); red arrow—mandibular angle. (F) Orthodontically indicated panoramic radiograph from the same patient two years earlier. Bilateral condylar resorption is already evident (white dashed rectangle) explaining clinical symptoms of severe TMJ pain, loss of mandibular mobility and dentofacial growth disturbances. Data are shown as mean ± SEM. Symbols represent individual mice. P values were determined by unpaired two-tailed t test for single comparisons. P-values less than 0.05 were considered statistically significant.
Figure 2
Figure 2
The TMJ of hTNFtg mice exhibits inflammation, cartilage degradation, and bone erosion. (A) Representative μCT images showing bone erosion (white arrows) in the hind paws of hTNFtg mice compared to littermate controls. The scale bar indicates 1 mm. (B) Hematoxylin and eosin (H&E) and tartrate-resistant acid phosphatase (TRAP) staining of the hind paws in hTNFtg mice versus littermate controls. Inflammation is represented by black triangles, while bone-resident osteoclasts are depicted with purple triangles. The scale bar represents 50 μm. (C) Histomorphometric analysis quantifying inflammation, bone erosion, and osteoclast numbers in the hind paws of hTNFtg mice compared to littermate controls (n=5). (D) mRNA expression levels of Nfatc1, Acp5, and Mmp9 in the ankle joints of hTNFtg mice relative to littermate controls (n=4-5). (E) Representative μCT images illustrating bone erosion (white arrows) in the mandibular condyle of hTNFtg mice compared to littermate controls. The scale bar represents 1 mm. (F) H&E and TRAP staining of the mandibular condyle in hTNFtg mice and littermate controls. Black triangles indicate inflammation, whereas purple triangles represent bone-resident osteoclasts. The scale bar represents 50 μm. (G) Histomorphometric quantification of inflammation, bone erosion, and osteoclast numbers in the mandibular condyle of hTNFtg mice compared to littermate controls (n=6–8). (H) mRNA expression of Nfatc1, Acp5, and Mmp9 in the temporomandibular joint (TMJ) of hTNFtg mice relative to littermate controls (n=4-5). Data are shown as mean ± SEM. Symbols represent individual mice. P values were determined by unpaired two-tailed t test for single comparisons. P-values less than 0.05 were considered statistically significant.
Figure 3
Figure 3
The TMJ of hTNFtg mice displays a unique pattern of immune cell infiltration and pro-inflammatory cytokine expression. (A) Proportions of CD45+ immune cells, CD4+ T helper cells, CD19+ B cells, CD11b+F4/80+ macrophages, and CD11b+Ly6G+ neutrophils in the ankle joints of hTNFtg mice compared to littermate controls (n=4-5). (B) mRNA expression levels of Tnfa, Il1b, Il6, Il17, Csf1, and Tnfsf11 in the ankle joints of hTNFtg mice relative to littermate controls (n=4-5). (C) Proportions of CD45+ immune cells, CD4+ T helper cells, CD19+ B cells, CD11b+F4/80+ macrophages, and CD11b+Ly6G+ neutrophils in the TMJ of hTNFtg mice compared to littermate controls (n=5). (D) mRNA expression levels of Tnfa, Il1b, Il6, Il17, Csf1, and Tnfsf11 in the TMJ of hTNFtg mice relative to littermate controls (n=4-5). Data are shown as mean ± SEM. Symbols represent individual mice. P values were determined by unpaired two-tailed t test for single comparisons. P-values less than 0.05 were considered statistically significant.
Figure 4
Figure 4
Bulk RNA sequencing reveals significant changes in the expressional profile of the TMJ as compared to the ankle joint of hTNFtg mice. (A) Principal component analysis (PCA) illustrating the distribution of individual samples across six groups (n=4): Ankle Control (Ank Ctr), Ankle hTNFtg (Ank hTNFtg), Alveolar Bone Control (AvB Ctr), Alveolar Bone hTNFtg (AvB hTNFtg), TMJ Control (TMJ Ctr), and TMJ hTNFtg. (B) Volcano plot depicting differentially expressed genes (DEGs) between Ankle hTNFtg and TMJ hTNFtg groups, with downregulated DEGs shown in blue and upregulated DEGs in red. (C) Gene Ontology (GO) enrichment bubble plot comparing Ankle hTNFtg and TMJ hTNFtg groups. The most relevant enriched pathways are highlighted with pink arrows when upregulated in the hTNFtg TMJ group and with yellow arrows when upregulated in the hTNFtg ankle group. Differential expression analysis was conducted with a log2 fold change threshold of 1.0. P-values were adjusted using the Benjamini–Hochberg method to control the false discovery rate (FDR). Genes with an adjusted P-value (Padj) less than 0.05 were considered differentially expressed.
Figure 5
Figure 5
Differential expression of pro-inflammatory and pro-osteoclastogenic genes in the TMJ compared to the ankle joint of hTNFtg mice. (A) Heatmap displaying rheumatoid arthritis-associated differentially expressed genes (DEGs) between the Ankle hTNFtg and TMJ hTNFtg groups. (B) Heatmap presenting osteoclast differentiation-associated DEGs between the Ankle hTNFtg and TMJ hTNFtg groups. The most relevant genes are highlighted with pink arrows when upregulated in the hTNFtg TMJ group and with yellow arrows when upregulated in the hTNFtg ankle group. Differential expression analysis was performed using a log2 fold change cutoff of 1.0. P-values were adjusted using the Benjamini–Hochberg method to control the false discovery rate (FDR). Genes with an adjusted P-value (Padj) less than 0.05 were classified as differentially expressed.
Figure 6
Figure 6
Elevated expression of metabolic genes in the TMJ relative to the ankle joint in hTNFtg mice. (A) Heatmap illustrating glycolysis-related differentially expressed genes (DEGs) between the Ankle hTNFtg and TMJ hTNFtg groups. (B) Heatmap showing TCA cycle-related DEGs between the Ankle hTNFtg and TMJ hTNFtg groups. (C) Heatmap depicting oxidative phosphorylation (OXPHOS)-related DEGs between the Ankle hTNFtg and TMJ hTNFtg groups. Differential expression analysis was conducted with a log2 fold change threshold of 1.0. P-values were adjusted using the Benjamini–Hochberg method to control the false discovery rate (FDR). Genes with an adjusted P-value (Padj) less than 0.05 were considered differentially expressed.
Figure 7
Figure 7
Graphical overview of distinct and shared molecular pathways contributing to joint damage in different anatomical sites in the hTNFtg model. While both joints show inflammation and bone/cartilage damage, the TMJ is characterized by metabolic and enzyme-driven bone resorption, whereas the ankle exhibits stronger immune cell recruitment and chemokine signaling. Figure partially generated with BioRender.

Similar articles

References

    1. Merola JF, Espinoza LR, Fleischmann R. Distinguishing rheumatoid arthritis from psoriatic arthritis. RMD Open. (2018) 4:e000656. doi: 10.1136/rmdopen-2018-000656, PMID: - DOI - PMC - PubMed
    1. Komatsu N, Takayanagi H. Mechanisms of joint destruction in rheumatoid arthritis - immune cell-fibroblast-bone interactions. Nat Rev Rheumatol. (2022) 18:415–29. doi: 10.1038/s41584-022-00793-5, PMID: - DOI - PubMed
    1. McInnes IB, Schett G. The pathogenesis of rheumatoid arthritis. N Engl J Med. (2011) 365:2205–19. doi: 10.1056/NEJMra1004965, PMID: - DOI - PubMed
    1. Zhang F, Wei K, Slowikowski K, Fonseka CY, Rao DA, Kelly S, et al. Defining inflammatory cell states in rheumatoid arthritis joint synovial tissues by integrating single-cell transcriptomics and mass cytometry. Nat Immunol. (2019) 20:928–42. doi: 10.1038/s41590-019-0378-1, PMID: - DOI - PMC - PubMed
    1. Udalova IA, Mantovani A, Feldmann M. Macrophage heterogeneity in the context of rheumatoid arthritis. Nat Rev Rheumatol. (2016) 12:472–85. doi: 10.1038/nrrheum.2016.91, PMID: - DOI - PubMed

MeSH terms

Substances

LinkOut - more resources