. 2025 Jul 28:18:319-358.
doi: 10.2147/NSA.S500407. eCollection 2025.

Safety Profile of Intravenous Ferulic Acid Nanoparticles: Acute Toxicity and Neurological Effects in Sprague-Dawley Rats

Affiliations

Safety Profile of Intravenous Ferulic Acid Nanoparticles: Acute Toxicity and Neurological Effects in Sprague-Dawley Rats

Hao Huang et al. Nanotechnol Sci Appl. .

Abstract

Background: Ferulic acid (FA) exhibits therapeutic potential for various disorders, but its clinical application is hindered by poor bioavailability and solubility. This study aimed to develop and evaluate FA-loaded lipid nanoparticles (FA-LNPs) as a safe and efficient drug delivery system.

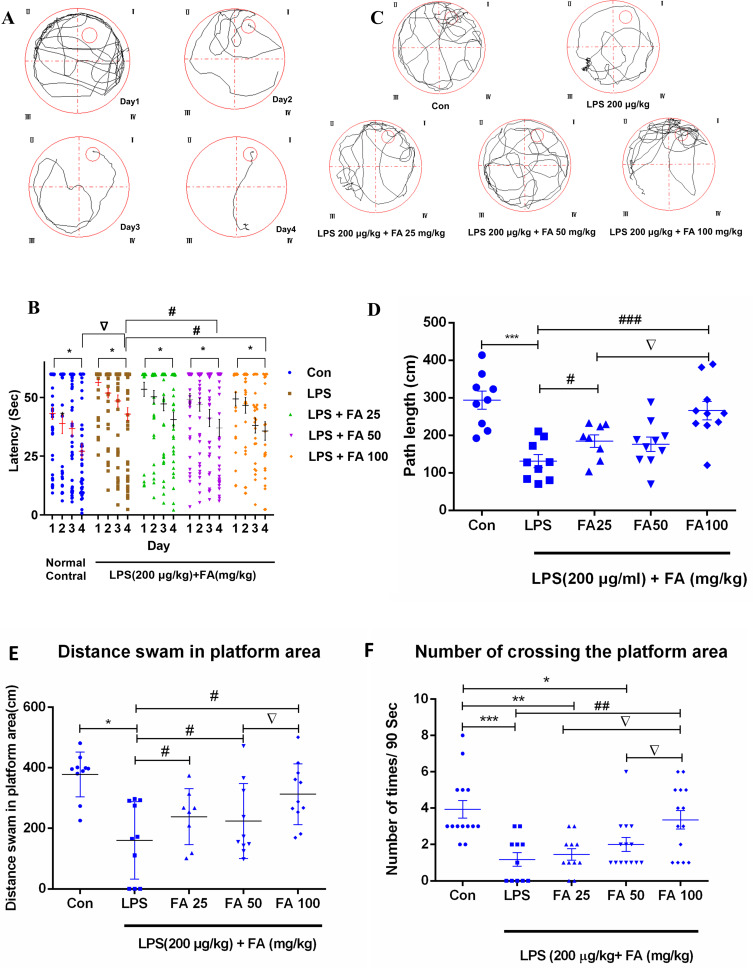
Methods: FA-LNPs were prepared via an optimized active loading method. The Morris water maze test was conducted to evaluate FA efficacy against LPS-induced cognitive impairment in rats. Comprehensive neurotoxicity assessment was performed in three brain regions (striatum, hippocampus, and cerebellum-brain stem) using multiple staining techniques (LFB, GFAP, IBA-1, and Fluoro-Jade) to evaluate myelin integrity, glial activation, and neuronal degeneration. Acute toxicity, pharmacokinetics, and network pharmacology analysis were conducted to assess safety profiles and potential mechanisms.

Results: FA-LNPs were successfully prepared using an optimized active loading method, achieving high drug loading (≥4 mg/mL), superior encapsulation efficiency (EE%) ≥80%, and uniform particle size distribution (<200 nm, PDI=0.053), zeta potential of +5.97 mV (Quality Factor = 1.701), excellent storage stability over two weeks, and was scaled up for batch production. The Morris water maze test revealed an effective FA concentration of 50 mg/kg, with FA-LNPs achieving 46.5 mg/kg through active loading method. Toxicological studies demonstrated favorable safety profiles. Pharmacokinetic analysis showed a prolonged elimination half-life (12.8 ± 1.88 hours) and moderate systemic clearance (0.535 ± 0.0851 L/h/kg). Short-term administration did not elicit significant neuroprotection. Network pharmacology analysis identified 141 potential therapeutic targets and five key proteins (EGFR, ESR1, PTGS2, CTNNB1, and STAT3), with molecular docking confirming favorable binding energies (-7.6 to -5.2 kcal/mol).

Conclusion: FA-LNPs enhanced FA's bioavailability without apparent systemic toxicity or neurotoxicity. While safe for short-term use, longer treatment durations may be necessary to observe potential neuroprotective benefits and toxicity. This study provides a foundation for further investigation of FA-LNPs as a promising drug delivery system for neurological disorders.

Keywords: Alzheimer’s disease; atherosclerosis; drug delivery; ferulic acid; liposome nanoparticles; network pharmacology; pharmacokinetics; toxicology.


Conflict of interest statement

The authors report no conflicts of interest.

Figures

None
Graphical abstract
Figure 1
Figure 1
Experimental schedule of drug treatment and test orders. Arrow heads represent days on which acquisition tests were conducted. FA (25, 50, or 100mg/kg) or its vehicle (0.9% saline containing 10% DMSO) was i.p. injected for 24 consecutive days. Before the beginning of the four days visible platform test in the Morris water-maze, LPS (200 μg/kg) or its vehicle were i.p. injected 12 hours after FA or its vehicle injected. On day 29, the water-maze acquisition trials were conducted four times a day for four consecutive days, followed by the probe trial test 12 hours after the last acquisition trial.
Figure 2
Figure 2
The core brain regions for observation. The core brain regions of interest for observation encompassed the striatum, hippocampus, and cerebellar-brainstem areas, we referenced Figures 27, 47, and 79 from “The Mouse Brain in Stereotaxic Coordinates - 4th Edition” (Paxinos and Franklin, 2012) as illustrated in Figure 2 (AC).
Figure 3
Figure 3
Continued.
Figure 3
Figure 3
Effects of FA on LPS-induced spatial cognitive deficits in the water-maze test in rats. (A) Representative searching swimming paths by rats with different treatments after four days acquisition session in the escape latency test. (B) Escape latency to find the submerged platform during 4 consecutive days of training. LPS administration (200 μg/kg) significantly impaired spatial learning, demonstrated by increased escape latency compared to control group. Pretreatment with ferulic acid (FA) at 25, 50, and 100 mg/kg dose-dependently attenuated this LPS-induced learning deficit. All groups showed effective learning as indicated by significantly reduced escape latency between Day 1 and Day 4. Data are presented as individual data points with means ± SEM (n=12/group). Statistical analysis was performed using two-way ANOVA followed by Sidak’s multiple comparisons test. * p<0.05 indicates significant differences between Day 1 and Day 4 within the same group, demonstrating effective training; p<0.05 indicates significant difference between control and LPS groups on Day 4, demonstrating LPS-induced cognitive impairment; # p<0.05 indicates significant differences between LPS group and FA treatment groups, demonstrating the protective effects of FA against LPS-induced cognitive dysfunction. (C) Representative searching swimming paths by rats with different treatments in the probe trial test. Control group rats swam concentrating the hidden platform area, LPS-treated rats swam primarily around the pool; this was reversed by FA pretreatment. (D) Effects of FA on the escape latency to reach the hidden platform. LPS overall decreased escape latency, which is altered by FA. E to H. Effects of FA pretreatment in the probe trial test with or without LPS stimulation in rats. (E) Distance swum in the target quadrant, (F) Number of crossing the hidden platform area, (G) Mean swimming speed in the probe trial test, (H) Duration in the hidden platform area. LPS decreased the swimming distance, the crossings, swimming speed and duration in the target quadrant, which were all reversed by FA (25, 50, or 100 mg/kg), whereas not in a strict dose-dependent manner. Values represent means ± S.E.M. (n=12 per group); * p<0.05, ** p<0.01, *** p<0.001 vs control group; # p<0.05, ## p<0.01, ### p<0.001 vs LPS group; p<0.05 for comparisons between different FA dosage groups (specifically indicating significant differences between FA 25 mg/kg vs FA 50 mg/kg or FA 100 mg/kg groups).
Figure 4
Figure 4
UPLC-MS analysis of the FA. (A) Representative chromatograms showing: base peak ion chromatogram of blank control (upper panel), base peak ion chromatogram of sample (middle panel), and extracted ion chromatogram at m/z 193.0501 (lower panel). (B) Full-scan mass spectrum (m/z 50–1200) of the sample at retention time 3.09 min. (C) Zoomed mass spectrum (m/z 100–300) of the sample at retention time 3.09 min.
Figure 5
Figure 5
Transmission electron microscopy (TEM) characterization of ferulic acid-loaded liposomal nanoparticles (FA-LNPs). (AC) Representative TEM micrographs at different magnifications showing spherical FA-LNPs with an average diameter of 80 nm. Samples were prepared by 3-fold dilution in phosphate buffer (pH 7.4). Scale bars: 500 nm and 50nm.
Figure 6
Figure 6
Dynamic Light Scattering (DLS) measurements of Ferulic Acid. The ferulic acid-loaded liposomes exhibited an increased hydrodynamic diameter compared to empty liposomes, with an approximate increase of 10 nm in saline and 5 nm in Tris buffer. The FA liposome nanoparticles synthesized using the microfluidic device demonstrated remarkable uniformity in size distribution, characterized by a Z-Average diameter of 83.85 nm and a low polydispersity index (PDI) of 0.053.
Figure 7
Figure 7
Zeta potential and stability analysis of FA-LNPs. Zeta potential distribution of FA-LNPs, showing a mean value of +5.969 mV, indicating moderate colloidal stability. Stability profile of FA-LNPs over two weeks, demonstrating no significant changes in particle size or polydispersity index (PDI). The optimized preparation process and unique surface properties contribute to the excellent stability of the nanoparticle formulation.
Figure 8
Figure 8
Continued.
Figure 8
Figure 8
Histopathological examination of major organs in rats across different treatment groups. (A) Representative histopathological images of major organs in control groups (H&E staining). (a1-c1) Blank control group: normal liver architecture with intact lobular structure and hepatic cords (a1); kidney showing clear cortical and medullary structures, with one animal exhibiting mild, diffuse hyaline droplet accumulation in renal tubules (b1); and normal cardiac tissue with well-preserved endocardium, myocardium, and epicardium (c1). (a2-c2) Vehicle control group (Con-LNPs): liver displaying normal architecture without pathological changes (a2); kidney with clear demarcation of cortical and medullary regions and no apparent abnormalities (b2); and heart tissue showing normal myocardial structure with distinct cardiomyocytes and intercalated discs (c2). Scale bar = 50 μm or 100 μm. (B) Representative histopathological changes in liver tissues of rats in LPS 200 μg/kg group. (a1) Liver section showing mild congestion (white arrow), increased sinusoidal cells (yellow arrow), mononuclear cell infiltration in the confluent area (green arrow), and focal hepatocellular necrosis with inflammatory cell infiltration (black arrow). (a2) Liver section demonstrating pigment deposition (Orange arrow) in Kupffer cells and hepatocytes. (a3) Liver section exhibiting hepatocellular vacuolation (purple arrow). Scale bars = 50 μm. H&E staining. (C). Representative histopathological changes in kidney and heart tissues of rats in LPS 200 μg/kg group. (a1) Kidney section showing normal renal architecture with well-preserved cortical and medullary structures, intact glomeruli and tubules (40× magnification). (b1) Heart section exhibiting multifocal myocardial alterations, including focal fibrosis with fibroblast proliferation and collagen deposition (light blue arrow), myocardial degeneration/necrosis characterized by widened interstitium, myofibril dissolution, increased cytoplasmic eosinophilia, and nuclear pyknosis (dark blue arrow), and myocardial hemorrhage (white arrow) (20× magnification). (b2) Higher magnification view of heart section from animal No. 16 showing detailed myocardial fibrosis and degeneration/necrosis (20× magnification). Note: Kidney tissue from animal No. 16 was excluded due to autolysis. Scale bars = 100 μm (b1, b2) and 50 μm (a1). H&E staining. (D) Representative histopathological changes in liver, kidney, and heart tissues of rats in LPS 100 μg/kg group. (a1) Liver section showing mild multifocal hepatocellular necrosis with inflammatory cell infiltration (black arrow), characterized by focal destruction of hepatic cords and inflammatory cell infiltration (40× magnification). (a2) Kidney section exhibiting mild multifocal tubular dilation (blue arrow), with preserved cortical and medullary structures and intact glomeruli (10× magnification). (b) Heart section from animal No. 43 displaying normal cardiac architecture with intact endocardium, myocardium, and epicardium, showing no significant pathological changes (20× magnification). Scale bars = 50 μm (a1), 200 μm (a2), 100 μm (a3) H&E staining. (E) Representative histopathological examination of major organs from rats treated with FA-LNPs (46.5 mg/kg × 2) for 7 days. (a) Liver section showing normal hepatic architecture without pathological changes (40× magnification). (b) Kidney section demonstrating moderate renal pelvic dilation (blue arrow) (6× magnification). (c, d) Heart sections exhibiting mild, multifocal myocardial degeneration/necrosis characterized by slightly widened interstitium, myofibril dissolution, and cytoplasmic vacuolation (dark blue arrow) (c), and mild, multifocal myocardial hemorrhage (white arrow) (d) (both at 20× magnification). Scale bars = 50 μm (a), 5000 μm (b), and 100 μm (c, d). H&E staining. FA-LNPs: ferulic acid -modified liposome nanoparticles. (F) Representative histopathological examination of brain tissues from rats across different treatment groups. (a1-e4) Photomicrographs showing striatum (a1-e1), hippocampus (a2-e2), cerebellum (a3-e3), and brainstem (a4-e4) from rats treated with: blank control group (a1-a4), Con-LNPs group (b1-b4), LPS 200 μg/kg group (c1-c4), LPS 100 μg/kg group (d1-d4), and FA-LNPs (46.5 mg/kg × 2) (e1-e4). All brain regions displayed normal architecture across treatment groups, with preserved cellular morphology in cerebral cortex, and no evidence of cellular disarray, apoptosis, hemorrhage, or inflammatory responses in the striatum, hippocampus, cerebellum, and brainstem. Note: Brain tissue from animal No. 16 in the high-dose LPS group was excluded due to autolysis. All images were taken at 100× magnification. Scale bars = 100 μm. H&E staining.
Figure 9
Figure 9
Histopathological analysis of rat brain tissues following repeated intravenous administration of FA liposome nanoparticles (FA-LNPs). Representative images of brain sections from (A1-C4) control group, (D1-F4) LPS group (200 μg/kg), and (G1-I4) LPS + FA-LNPs group (200 μg/kg LPS + 46.5 mg/kg FA-LNPs). No significant histopathological changes were observed across all groups. H&E staining revealed normal brain structure with intact meninges, cortical layers, and white matter. LFB staining showed no evidence of demyelination in any group. There was no perivascular cuffing or meningeal infiltration of lymphocytes and macrophages observed in any of the examined sections. This comprehensive histopathological analysis suggests that repeated intravenous administration of FA-LNPs does not induce detectable neuropathological changes in rat brain tissues, even in the presence of LPS-induced inflammation.
Figure 10
Figure 10
GFAP immunostaining analysis and quantitative assessment of astrocyte activation in rat brain tissues. (A) GFAP immunostaining analysis of astrocyte activation in rat brain tissues. (a1-i3) Representative images of GFAP immunostaining in the control, LPS (200 μg/kg), and LPS+FA-LNPs (200 μg/kg LPS + 46.5 mg/kg FA-LNPs) groups. Scale bar: 2000 μm (2×), 500 μm (10×) and 100 μm (40×). (B) Quantification of GFAP-positive area ratio (GFAP-positive area / total brain tissue area) across different treatment groups. Data are presented as mean ± SEM. **p < 0.01 compared to the control group. ns: not significant compared to the LPS group. n = 6 per group. GFAP staining revealed significant astrocyte activation in the LPS group compared to the control (p < 0.01), indicating successful induction of neuroinflammation. The LPS+FA-LNPs group showed no significant difference in GFAP expression compared to the LPS group (p > 0.05), suggesting that FA-LNPs did not significantly inhibit LPS-induced astrocyte activation under these experimental conditions. Images were captured at 400× magnification using a 3DHISTECH P250 scanner and analyzed with Quant Center software.
Figure 11
Figure 11
Evaluation of FA-LNPs on LPS-Induced microglial activation in rat brain using Iba-1 immunostaining analysis. (A) Iba-1 immunostaining analysis of microglial activation in rat brain tissues. (a1-i3) Representative images of Iba-1 immunostaining in the control, LPS (200 μg/kg), and LPS+FA-LNPs (200 μg/kg LPS + 46.5 mg/kg FA-LNPs) groups. Scale bar: Scale bar: 2000 μm (2×), 500 μm (10×) and 100 μm (40×). (B) Quantification of Iba-1-positive area ratio (Iba-1-positive area / total brain tissue area) across different treatment groups. Quantification of Iba-1-positive cell ratio (number of Iba-1-positive cells / total number of brain cells) across different treatment groups. Data are presented as mean ± SEM. *p < 0.05 compared to the control group. n = 6 per group. Iba-1 staining demonstrated significant microglial activation in the LPS group compared to the control (p < 0.05). FA-LNPs treatment did not effectively suppress this activation in the short term (p > 0.05), as evidenced by both area ratio and cell ratio analyses. Images were captured at 400× magnification using a 3DHISTECH P250 scanner and analyzed with Quant Center software.
Figure 12
Figure 12
Fluoro-Jade B (FJB) staining showing neurodegeneration in rat brain tissues following LPS and FA-LNP treatments. (A) Representative images of FJB staining in rat brain tissues. Scale bar: 2000 μm (2×), 500 μm (10×) and 100 μm (40×). (B) Quantification of FJB-positive neurons using a semi-quantitative scoring system. Bars represent mean ± SEM (n = 6 per group). *p < 0.05 compared to control group; ns: not significant compared to LPS group (one-way ANOVA followed by Tukey’s post-hoc test). FJB staining was performed to evaluate neuronal degeneration. Deparaffinized and rehydrated sections were incubated with FJB working solution overnight at 4°C, counterstained with DAPI, and coverslipped. Images were acquired using a Pannoramic 250 slide scanner. FJB-positive neurons were scored using a 5-point scale (0–4) based on the percentage of stained neurons, where 0 indicates no neuropathology and 4 indicates severe neuropathology (>45% of neurons stained). LPS treatment significantly increased FJB-positive neurons compared to the control group (*p < 0.05), indicating enhanced neurodegeneration. FA-LNPs treatment showed no significant difference compared to the LPS group (ns, p > 0.05), suggesting that FA-LNP treatment did not effectively attenuate LPS-induced neurodegeneration.
Figure 13
Figure 13
Network pharmacology analysis revealing the potential mechanisms of FA. (A) Venn diagram illustrating the overlap between FA targets and disease-related genes. (B) Compound-disease-target network analysis showing the interactions between FA (green diamond), diseases (red diamonds), common targets (purple triangles), and specific targets (grey circles). (C) Protein-protein interaction (PPI) network of common targets consisting of 141 nodes and 794 edges, where node size represents degree value and edge thickness indicates interaction confidence score (minimum required score = 0.400). (D) Top 10 significantly enriched Gene Ontology (GO) terms (p<0.05, q<0.05) across biological process (BP), cellular component (CC), and molecular function (MF) categories. Bar length represents -log10(p-value), color intensity indicates significance level, and bar width shows gene count. (E) Top 20 significantly enriched KEGG pathways (p<0.05), highlighting key pathways including nitrogen metabolism, AGE-RAGE signaling, metabolic pathways, and ROS-related chemical carcinogenesis. Bar representation follows the same format as in (D).
Figure 14
Figure 14
Molecular docking analysis revealing the binding modes of FA with key target proteins. (AE) Two-dimensional (left panels) and three-dimensional (right panels) representations of FA interactions with (A) EGFR (PDB: 5ug9), (B) ESR1 (PDB: 7nfb), (C) PTGS2 (PDB: 5f19), (D) CTNNB1 (PDB: 7afw), and (E) STAT3 (PDB: 6njs). Hydrogen bonds are shown as green dashed lines, while hydrophobic and π-π stacking interactions are depicted in pink and Orange, respectively. Protein surface electrostatic potential is represented by different colors (red: negative, blue: positive, white: neutral). Binding energies were calculated ranging from −7.6 kcal/mol for PTGS2 to −5.2 kcal/mol for CTNNB1.

Similar articles

References

    1. Murakami A, Kadota M, Takahashi D, et al. Suppressive effects of novel ferulic acid derivatives on cellular responses induced by phorbol ester, and by combined lipopolysaccharide and interferon-gamma. Cancer Lett. 2000;157(1):77–85. doi: 10.1016/S0304-3835(00)00478-X - DOI - PubMed
    1. Hosoda A, Ozaki Y, Kashiwada A, et al. Syntheses of ferulic acid derivatives and their suppressive effects on cyclooxygenase-2 promoter activity. Bioorg Med Chem. 2002;10(4):1189–1196. doi: 10.1016/S0968-0896(01)00386-8 - DOI - PubMed
    1. Ou L, Kong LY, Zhang XM, Niwa M. Oxidation of ferulic acid by momordica charantia peroxidase and related anti-inflammation activity changes. Biol Pharm Bull. 2003;26(11):1511–1516. - PubMed
    1. Srinivasan M, Sudheer AR, Menon VP. Ferulic acid: therapeutic potential through its antioxidant property. J Clin Biochem Nutr. 2007;40(2):92–100. doi: 10.3164/jcbn.40.92 - DOI - PMC - PubMed
    1. Yan JJ, Cho JY, Kim HS, et al. Protection against beta-amyloid peptide toxicity in vivo with long-term administration of ferulic acid. Br J Pharmacol. 2001;133(1):89–96. doi: 10.1038/sj.bjp.0704047 - DOI - PMC - PubMed

LinkOut - more resources