. 2025 Aug 1:15:34.
doi: 10.5334/tohm.1039. eCollection 2025.

Thalamic and Visual Network Dysfunction Relates to Tremor Response in Thalamic Deep Brain Stimulation

Affiliations

Thalamic and Visual Network Dysfunction Relates to Tremor Response in Thalamic Deep Brain Stimulation

Aimee E Morris et al. Tremor Other Hyperkinet Mov (N Y). .

Abstract

Background: Essential tremor (ET) is the most common movement disorder in adults, but its pathogenesis is incompletely understood. Deep brain stimulation of the ventral intermediate thalamic nucleus (VIM DBS) provides effective treatment for medically-refractory cases. We aimed to determine how pre-surgical resting-state functional connectivity (FC) in medically-refractory ET relates to VIM DBS clinical response.

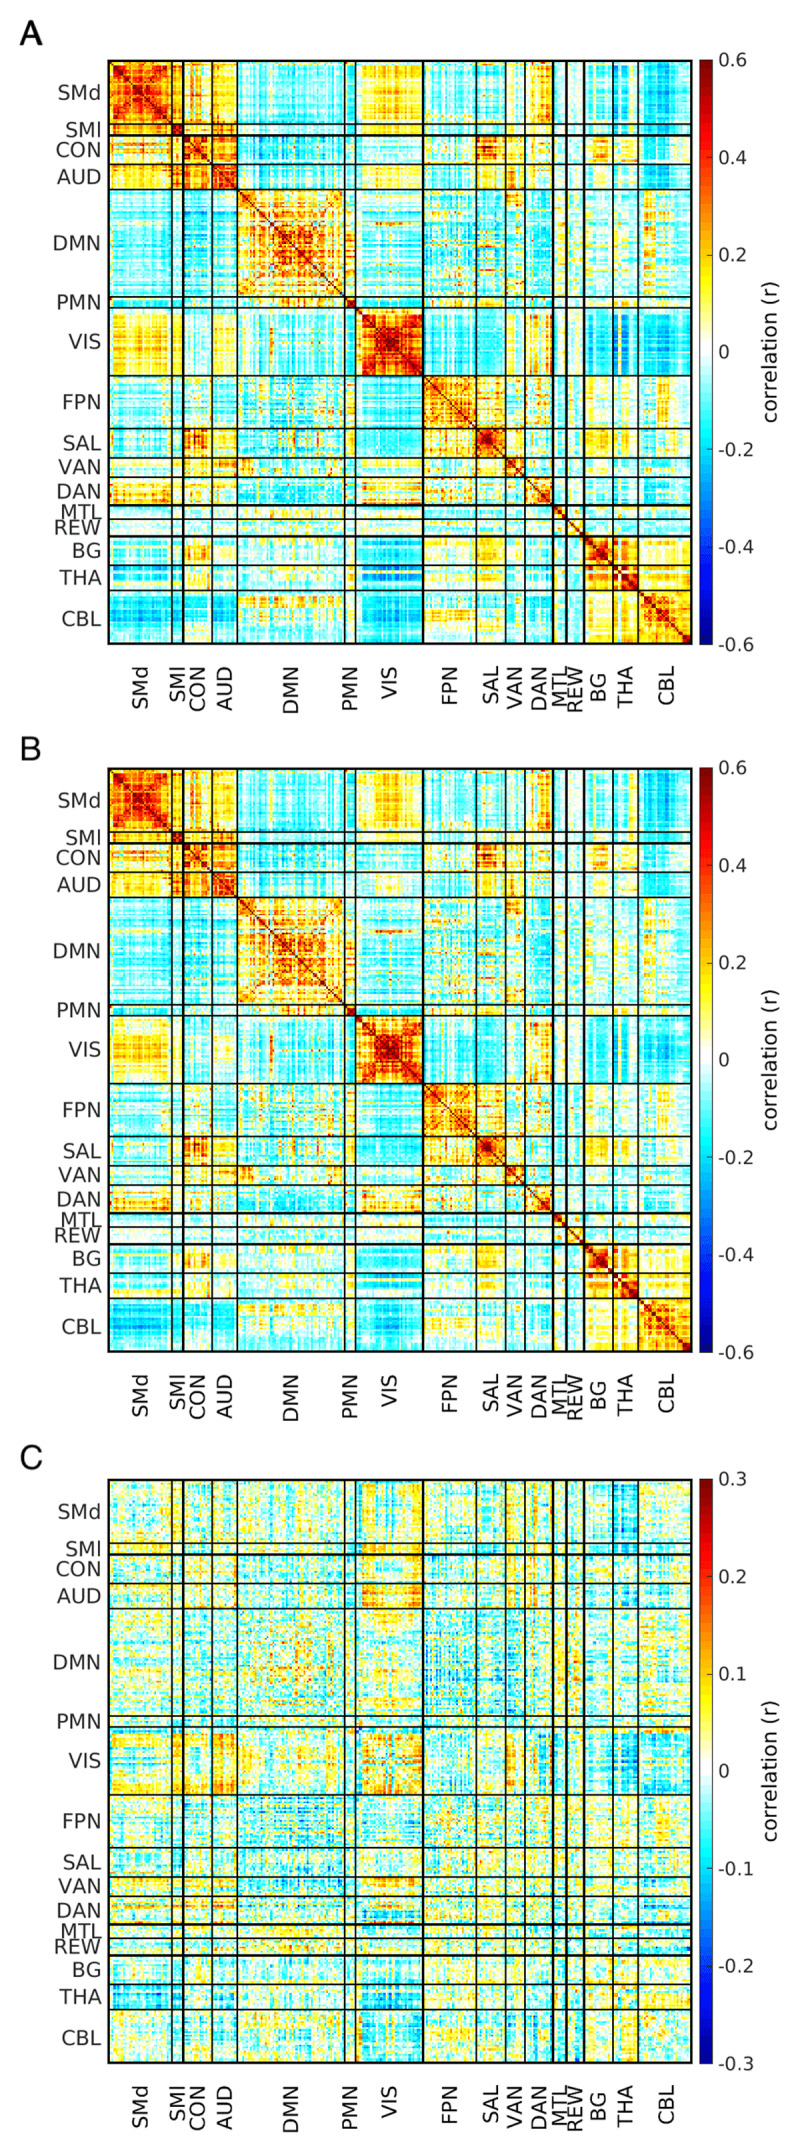
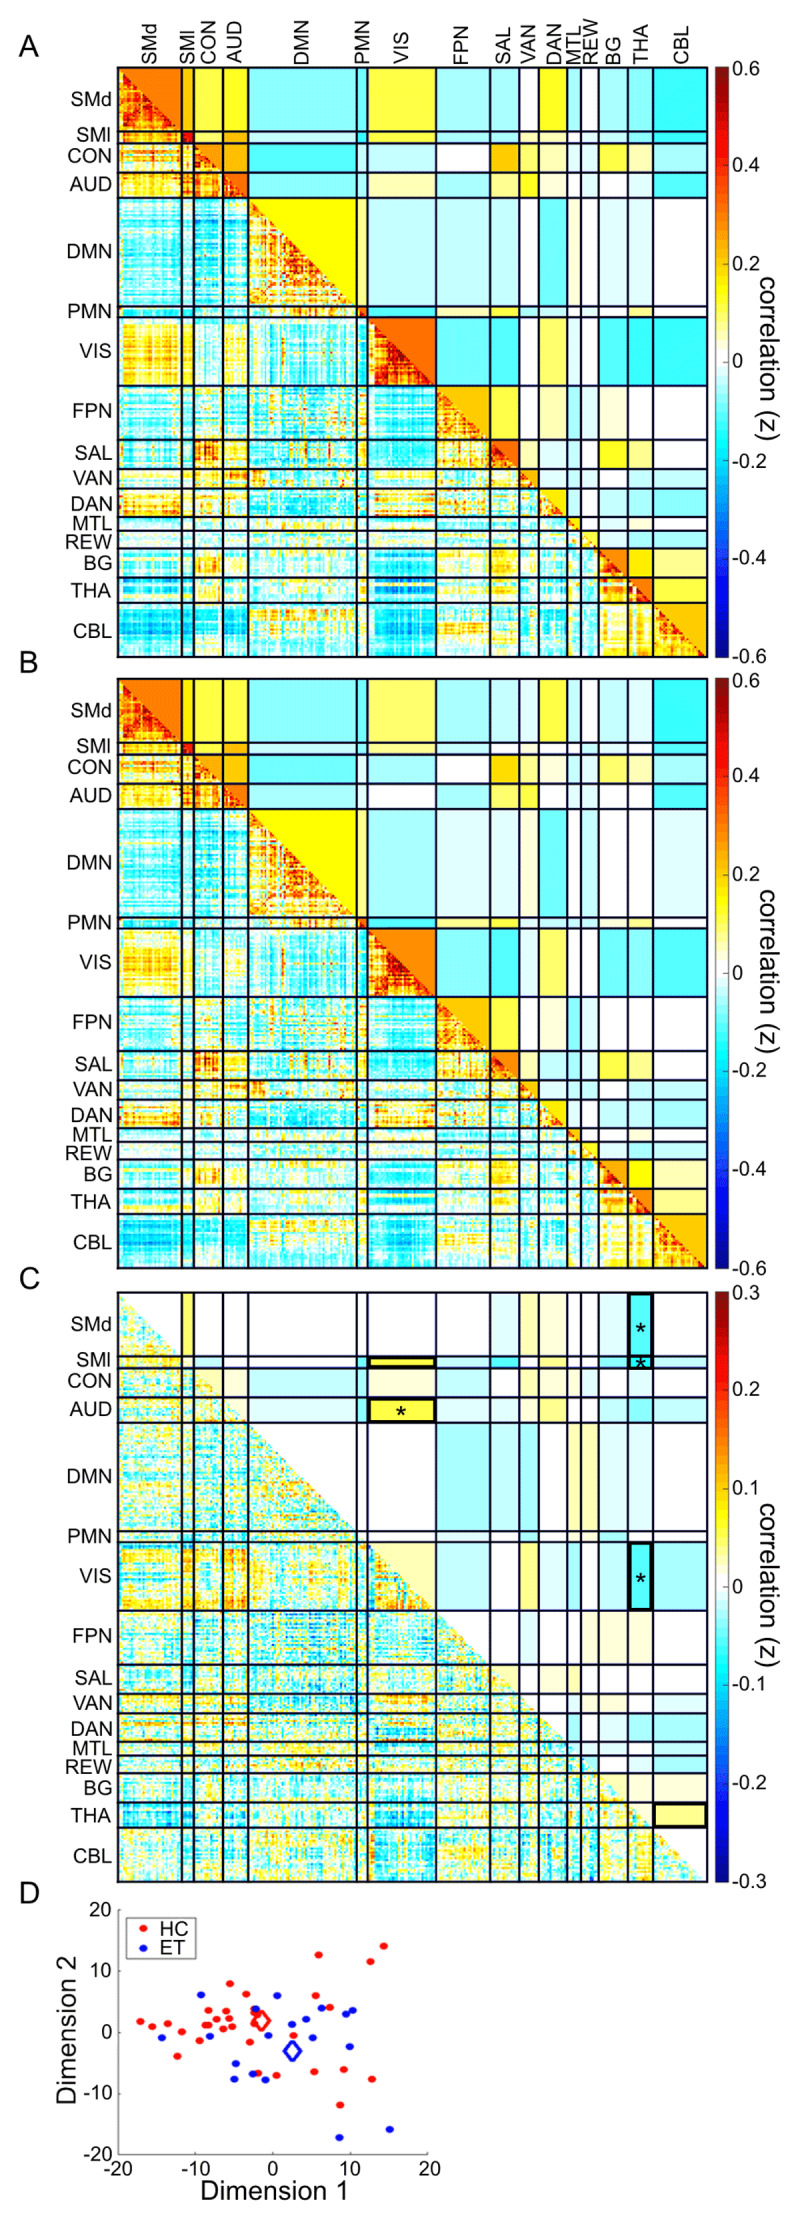
Methods: We analyzed resting-state FC MRI in 21 participants with medically-refractory ET who subsequently underwent VIM DBS and 34 matched controls. We applied rigorous quality assurance to minimize motion artifact. Whole-brain correlation matrices were computed across 300 cortical, subcortical, and cerebellar regions and compared across groups using object-oriented data analysis, a powerful novel approach. We used multiple linear regression to determine whether network FC (calculated as mean cross-correlation between nodes) in defined networks predicts VIM DBS response. We assessed regional FC using a seed in motor thalamus.

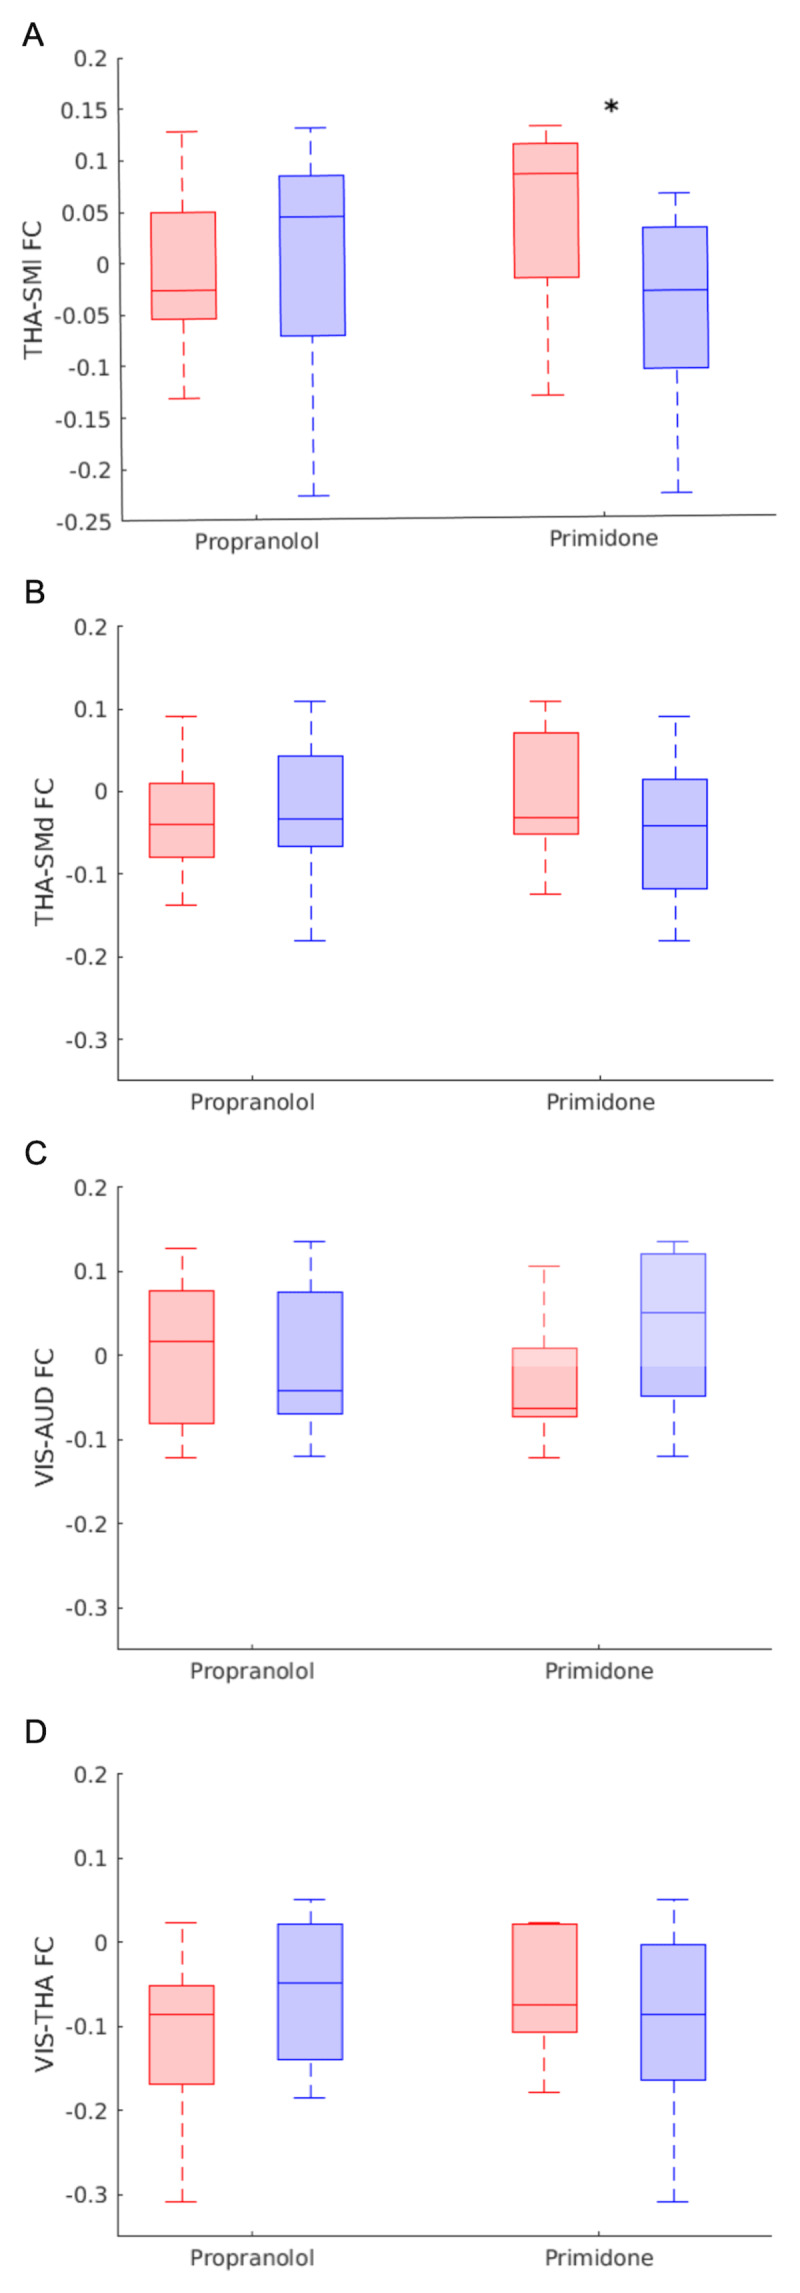
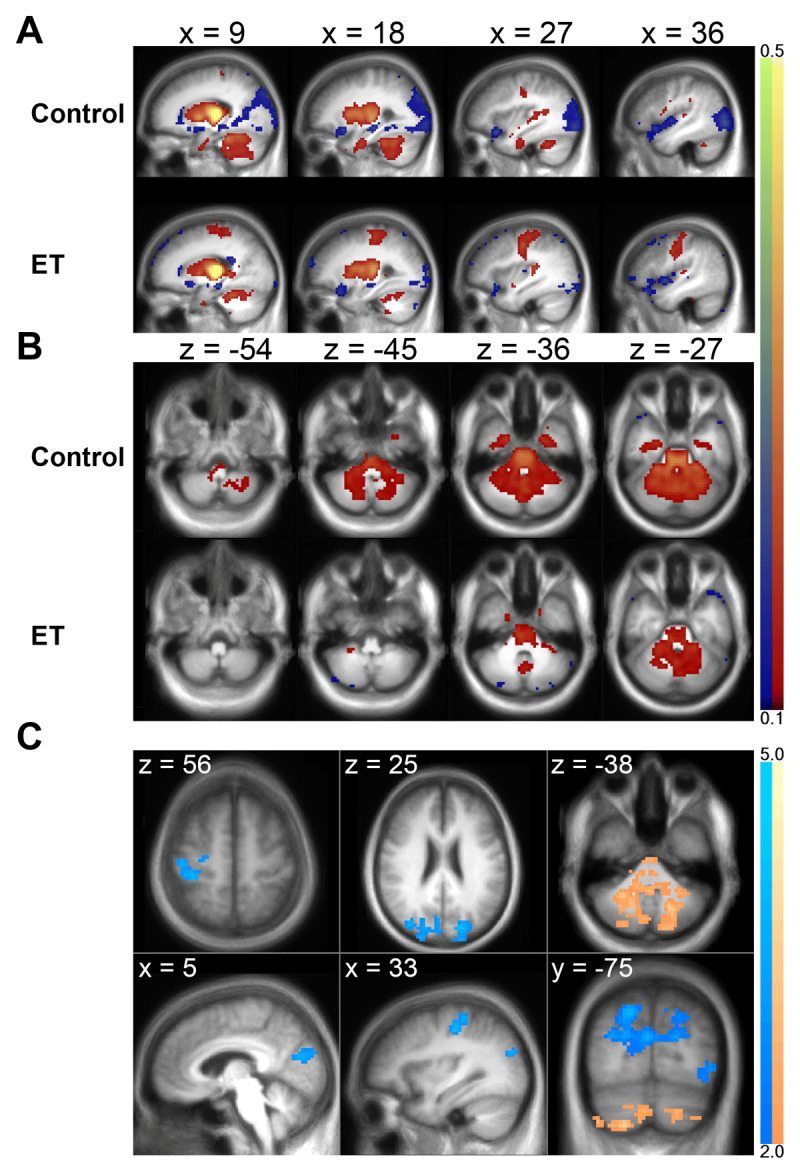
Results: Whole-brain correlation matrices and regional motor thalamus FC differed significantly between groups. Post-hoc network-level testing revealed decreased thalamus-somatomotor, thalamus-visual, and auditory-visual FC in ET versus controls. Regional FC showed increased primary motor cortex and decreased occipital-parietal and cerebellar FC with motor thalamus in ET relative to controls. Visual-lateral somatomotor network FC negatively predicted tremor improvement with VIM DBS.

Discussion: Whole-brain, network, and regional FC results demonstrate cerebello-thalamo-motor pathway dysfunction in ET. Robust FC differences in motor and visual regions related to VIM DBS outcomes. These results, employing rigorous quality control, support the need for additional investigation into the role of visual cortical networks in ET and DBS response.

Keywords: Essential tremor; functional connectivity; resting-state fMRI.


Conflict of interest statement

The authors have no competing interests to declare.

Figures

Whole-brain FC correlation matrices for control, ET, and subtraction
Figure 1
Group-level connectomes in ET and Controls. Large-scale functional connectomes in (A) Control and (B) ET participants reveal grossly similar resting state network organization, consistent with resting state network architecture found in other cohorts of healthy adults. Warm and cool colors indicate positive and negative correlations, respectively. C: A subtraction matrix (Control minus ET) shows selective network-to-network blocks of altered FC in ET, particularly involving thalamus and visual internetwork FC.
Central-weighted connectome objects (g*) for control, ET, and subtraction
Figure 2
Disruption of large-scale network structure in ET. Central weighted connectome object (g*) for (A) Control and (B) ET groups and (C) subtraction (Control g* – ET g*). Upper triangles show composite block FC scores (average cross-correlation between seeds) while the lower triangles show the matrix objects with all edges preserved. Connectome objects differ significantly between ET and controls. Black outlines in the upper triangle indicate blocks chosen a priori for hypothesis testing of ET versus controls. Stars indicate blocks with significantly different network FC between ET and controls. Note the color scale difference in (C). D: Multidimensional scaling plot demonstrates separation of ET and control connectomes represented in 2-dimensional space. Diamonds indicate the central object for each group.
Box plots of medication effects on inter-network functional connectivity
Figure 3
Medication effects on network FC. Composite FC scores for (clockwise from top left) thalamus-lateral somatomotor, visual-auditory, thalamus-dorsal somatomotor, and visual-thalamus networks in ET participants taking (red) and not taking (blue) propranolol (N: taking = 9, not taking = 12) or primidone (N: taking = 10, not taking = 11) at the time of MRI. The central line within each box indicates median FC. The bottom and top edges of the box represent the 25th and 75th percentiles, respectively. The whiskers indicate the minimum and maximum FC values within each group. *P < 0.05, uncorrected.
ET and control motor thalamus functional connectivity differences
Figure 4
Bilateral motor thalamus FC in ET and controls. A-B: ET and control group average correlation maps for a bilateral motor thalamus seed are depicted in the (A) sagittal and (B) axial planes. In both groups, motor thalamus has positive FC with sensorimotor areas, cerebellum, and the whole thalamus and negative FC with occipitoparietal and superior temporal lobes. Color maps are thresholded at |z| ≥ 0.1. Warm colors represent positive and cool colors represent negative correlations. C: Clusters of significant group difference are shown for the group effect z-score subtraction map (control minus ET) in the axial, coronal, and sagittal planes. The ET group has significantly increased FC with right sensorimotor cortex and decreased FC with occipitoparietal lobes, depicted in the first two columns. Note, ET has an increased magnitude of positive FC with sensorimotor cortex and decreased magnitude of negative FC with occipitoparietal cortex, both of which appear as net negative values in the difference map. The cerebellum has decreased FC in ET, shown in the rightmost column.

Similar articles

References

    1. Bhatia KP, Bain P, Bajaj N, et al. Consensus Statement on the classification of tremors. from the task force on tremor of the International Parkinson and Movement Disorder Society. Mov Disord. 2018;33:75–87. DOI: 10.1002/mds.27121 - DOI - PMC - PubMed
    1. He S, West TO, Plazas FR, et al. Cortico-thalamic tremor circuits and their associations with deep brain stimulation effects in essential tremor. Brain. 2025;148:2093–2107. DOI: 10.1093/brain/awae387 - DOI - PMC - PubMed
    1. Hershey T, Mink JW. Using functional neuroimaging to study the brain’s response to deep brain stimulation. Neurology. 2006;66:1142–1143. DOI: 10.1212/01.wnl.0000216425.34178.dd - DOI - PubMed
    1. Fang W, Chen H, Wang H, et al. Essential tremor is associated with disruption of functional connectivity in the ventral intermediate Nucleus—Motor Cortex—Cerebellum circuit. Hum Brain Mapp. 2016;37:165–78. DOI: 10.1002/hbm.23024 - DOI - PMC - PubMed
    1. Gallea C, Popa T, Garcia-Lorenzo D, et al. Intrinsic signature of essential tremor in the cerebello-frontal network. Brain. 2015;138:2920–2933. DOI: 10.1093/brain/awv171 - DOI - PMC - PubMed

LinkOut - more resources