. 2025 Jun 23;15(15):7545-7566.
doi: 10.7150/thno.110178. eCollection 2025.

Lung cancer diagnosis through extracellular vesicle analysis using label-free surface-enhanced Raman spectroscopy coupled with machine learning

Affiliations

Lung cancer diagnosis through extracellular vesicle analysis using label-free surface-enhanced Raman spectroscopy coupled with machine learning

Hai-Sha Liu et al. Theranostics. .

Abstract

Rationale: Label-free surface-enhanced Raman spectroscopy (SERS) based on extracellular vesicles (EVs) has great potential in cancer diagnosis. However, the repeatability and stability of the SERS signals and the accurate early prediction of multiple cell types based on a small number of samples still require further research. Methods: We developed a highly accurate classification approach to distinguish EVs derived from lung cancer and normal cells. This method was further validated using mixed samples of cell-derived EVs and plasma-derived EVs from both healthy and lung cancer mouse models and patients. The approach integrates label-free SERS analysis of EVs with machine learning techniques, including support vector machines (SVM) and convolutional neural networks (CNN), for robust classification. To preserve the native state of EVs, a capillary-based liquid-phase sampling method was employed, avoiding the need for drying. Additionally, the size and related properties of the SERS substrates were systematically optimized. Bayesian optimization was further applied to refine the SVM hyperparameters, enhancing classification performance. Results: The classification error rate of the five-fold cross-validation (CVloss) of the SVM model (with hyperparameters optimized by Bayesian method) of A549 and BEAS-2B cell-derived EVs was 3.7%, and the overall accuracy of the independent test set reached 98.7%. The results of principal component analysis, the Shapley values and partial dependence plot analysis indicate higher levels of collagen and adenine in cancer cells compared to normal cells, this may be due to the large amount of collagen used as a source of nutrients in cancer cells and abnormal DNA or RNA metabolism. The overall accuracy of the test set predicted by the SVM and CNN models of plasma-derived EVs from lung cancer and healthy mice was 97.5 % and 95.8 %, respectively. Finally, the proposed strategy was used to discriminate plasma-derived EVs from lung cancer patients and healthy people, the CVloss of the SVM and CNN model was 7.7% and 8.3%, the overall accuracy of the independent test set was 91.5% and 95.4%, respectively. Conclusions: The proposed machine learning-assisted, liquid-phase enhanced SERS method offers notable advantages, including minimal sample volume, high stability, and excellent accuracy. The promising classification performance demonstrates its potential as a rapid and reliable approach for the early detection and monitoring of lung cancer through clinical blood sample analysis.

Keywords: convolutional neural network; deep learning; extracellular vesicles; machine learning; surface-enhanced Raman spectroscopy.


Conflict of interest statement

Competing Interests: The authors have declared that no competing interest exists.

Figures

Figure 1
Figure 1
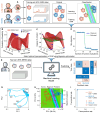
Schematic of the method flow. (A) Sampling. (B) Isolation of EVs. (C) Measurement of SERS. (D) Raman spectra. (E) Modelling. (F) Loadings of PCA. (G) Scores of PCA. (H) Confusion matrix.
Figure 2
Figure 2
Characterization and performance testing of AuNPs. (A) Schematic of AuNPs synthesis and SERS detection. (B) TEM and (C) ultraviolet-visible absorption spectra of the AuNPs. (D) Enhancement of exosomes by three different sizes of AuNPs (taking HEK as an example). (E) Raman spectra of R6G (1 × 10⁻² M) and SERS spectra measured by dropping R6G (1 × 10⁻⁵ M) in AuNPs. (F) SERS spectra measured at 24 different locations on the substrate for 10-5 M R6G. (G) The band intensities and their relative standard deviations of the SERS spectra measured at 1363 cm-1 and at the 24 locations above.
Figure 3
Figure 3
Isolation and characterization of EVs. (A) The process diagram of the ultracentrifugation separation of the external vesicles. (B) TEM images characterizing the morphology of the isolated vesicles (scale bar: 200 nm). (C) NTA results for five EVs. (D) DLS particle size distribution of five EVs. (E) WB results of EV markers CD63 and TSG101.
Figure 4
Figure 4
Spectral preprocessing and peak assignment analysis. (A) MPLS-based background removal. (B)Smoothing using DFT. (C) Raman spectra after pretreatment of A549, BEAS-2B, HEK, HeLa, and HepG2. (D) Peak attribution results. Spectra from the first sample of A549 are selected in (A) and (B) to show the spectral preprocessing process.
Figure 5
Figure 5
Machine learning (ML) model construction and prediction of A549 and BEAS-2B cell-derived EVs. (A) Schematic for constructing a ML classification model based on EV SERS spectra. (B) and (C) use Bayesian optimization to optimize the parameters of the SVM algorithm. (D) Convergence plot of the SVM algorithm. (E) Independent test set. (F) Confusion matrix using the SVM model for independent test sets. (G) Loading plot of PCA. (H) Maximum posterior probability plot. (I) ROC curves and AUC values for the independent test set.
Figure 6
Figure 6
Construction and prediction of deep learning models of five cell-derived EVs. (A) Schematic of five cell sources. (B) Loss function (cross-entropy loss) curves of the training set and validation set. (C) Accuracy curves of the training set and validation set. (D) Schematic of the CNN model architecture. (E) Independent test set. (F) Confusion matrix using the CNN model for independent test sets. (G) Loading plot of PCA. (H) Score plot of PCA. (I) ROC curves and AUC values of the independent test set.
Figure 7
Figure 7
The classification results of the SVM and CNN models for the exosome mixed samples, animal samples and clinical samples, respectively. Confusion matrix (A) and ROC curve (B) of SVM and confusion matrix (C) and ROC curve (D) of CNN for independent test set of the mixed samples of A549 and BEAS-2B cell-derived exosomes. Confusion matrix (E) and ROC curve (F) of SVM and confusion matrix (G) and ROC curve (H) of CNN for independent test set of the plasma-derived exosome samples from lung cancer and healthy mice. Confusion matrix (I) and ROC curve (J) of SVM and confusion matrix (K) and ROC curve (L) of CNN for independent test set of the plasma-derived exosome samples from lung cancer patients and healthy people.
Figure 8
Figure 8
Interpretation of the machine learning model for the real clinical samples of lung cancer patients. (A) Shapley summary plot of the lung cancer class (Variables are marked in black). (B) Shapley explanation of a single query sample of the lung cancer class (Variables are marked in red). (C)-(E) PDPs for the three important variables.

Similar articles

References

    1. Siegel RL, Miller KD, Fuchs HE, Jemal A. Cancer statistics, 2022. CA Cancer J Clin. 2022;72:7–33. - PubMed
    1. Crosby D, Bhatia S, Brindle KM, Coussens LM, Dive C, Emberton M. et al. Early detection of cancer. Science. 2022;375:eaay9040. - PubMed
    1. Vázquez-Iglesias L, Stanfoca Casagrande GM, García-Lojo D, Ferro Leal L, Ngo TA, Pérez-Juste J. et al. SERS sensing for cancer biomarker: Approaches and directions. Bioact Mater. 2024;34:248–68. - PMC - PubMed
    1. Naureen J, Debabrata M. Exosomes and their role in the micro-/macro-environment: A comprehensive review. J Biomed Res. 2017;31:386–94. - PMC - PubMed
    1. Stahl PD, Barbieri MA. Multivesicular bodies and multivesicular endosomes: The "ins and outs" of endosomal traffic. Sci STKE. 2002;2002:32. - PubMed