. 2025 Jun 23;12(9):uhaf157.
doi: 10.1093/hr/uhaf157. eCollection 2025 Sep.

A NAC family gene PmNAC32 associated with photoperiod promotes flower induction in Prunus mume

Affiliations

A NAC family gene PmNAC32 associated with photoperiod promotes flower induction in Prunus mume

Chengdong Ma et al. Hortic Res. .

Abstract

The photoperiod is essential to flower induction, and the exact timing of the process can be precisely regulated based on the relative duration of light and darkness. However, the mechanisms linking photoperiod and flower induction in woody plants remain largely unexplored. Using RNA-seq, we identified a photoperiod response factor PmNAC32, which is predominantly expressed in early-flowering varieties. Overexpression of PmNAC32 in Arabidopsis thaliana, tobacco, and Prunus mume calli resulted in accelerated flowering. Binding and activation analyses revealed that PmNAC32 can be directly suppressed by REVEILLE 1 (RVE1) and REVEILLE 3 (RVE3), implying that PmNAC32 plays a role in the photoperiodic signaling pathway. Further studies established that PmNAC32 functions as a positive regulator of CONSTANS-LIKE 5 (COL5) and a negative regulator of CONSTANS-LIKE 4 (COL4). Interestingly, we identified two homologs of PmNAC32, namely PmNAC29 and PmNAC47. These three proteins can interact with each other and enhance the regulation of PmCOL4 and PmCOL5. Although PmNAC29 and PmNAC47 can promote flower induction respectively, neither of them responded to the photoperiod. Thus, our results reveal a novel mechanism by which PmNAC32 regulates flower induction in Prunus mume.


Conflict of interest statement

The authors declare that they have no competing interests.

Figures

Figure 1
Figure 1
High-resolution temporal maps of P. mume leaf-related transcripts under LD and SD conditions. (A) and (B) Temporal clustering showed the gene expression changes under LD and SD conditions, which were divided into 12 clusters (LDC1–LDC12; SDC1–SDC12). The autoscaling log2(FPKM) values of transcripts in each cluster are shown. The number of transcription factors/genes. C, cluster. ZT means Zeitgeber time. White and black rectangles represent the photoperiod (light and dark phases). (C) and (D) Expression profiles of time-cluster genes under LD and SD conditions. (E) and (F) Functional clusters of KEGG functions enriched in differential clusters (LDC1–LDC12; SDC1–SDC12).
Figure 2
Figure 2
Identification and expression patterns of PmNAC32. (A) Correlation analysis between the PmNAC32 and central oscillator genes under LD conditions. (B) Correlation analysis between the PmNAC32 and central oscillator genes under SD conditions. (C) The transcriptional response to the varying photoperiod. The x-axis indicates the temporal point of sampling. Values are indicated as mean ± SE (n = 3). (D) qRT-PCR analysis of P. mume in different tissues at different periods. Error bars indicate the standard errors for three biological replicates. R, root. ST1, green stem. ST2, brown stem. L1, leaf bud. L2, tender leaf. L3, mature leaf. L4, yellow leaf. FL1, flower bud physiological differentiation stage. FL2, flower bud morphological differentiation stage. FL3, flower bud expansion stage. FL4, open flower. FS1, small size fruit. FS2, medium size fruit. FS3, big size fruit. FS4, mature fruit. SE1, pit of small fruit. SE2, pit of medium fruit. SE3, pit of big fruit. Values are indicated as mean ± SE (n = 3). (E–H) Western blot analysis of PmNAC32 protein in LD and SD conditions in P. mume leaves was performed using anti-PmNAC32 antibody. Image J was used for intensity analysis. Values are indicated as mean ± SE (n = 2). (I) Flower bud development of different varieties at the same time. The five late-flowering varieties above, the five early-flowering varieties below. DQD: ‘Da Qiandi’; YNHM: ‘Yunnan Hongmei’; XYQ: ‘Xi Yeqing’; DBM: ‘Da Baimei’; FH: ‘Fenghou’; LY: ‘Longyan’; SM: ‘Shamei’; FJBM: ‘Fujian Baimei’; TXM: ‘Tao Xingmei’; DHQ: ‘Da Heqing’. Bars in (I) = 4 cm. (J) The expression levels of PmNAC32 were tested in 10 P. mume varieties. Statistical significance was determined using a one-way analysis of variance (ANOVA). Different letters indicate statistically significant differences (P < 0.05)
Figure 3
Figure 3
Overexpression of PmNAC32 accelerates flowering time. (A) Flowering time phenotype of 26-day-old WT, PmNAC32-OE1-31, PmNAC32-OE2, and PmNAC32-OE3 under LD conditions. Bars in (A) = 5 cm. (B) Average bolting time of A. thaliana (OE lines and WT) shown in (A). Values are indicated as mean ± SE (n = 15). (C) Average number of leaves of A. thaliana (OE lines and WT). Values are indicated as mean ± SE (n = 15). (D) Flowering time phenotype of 95-day-old plants of the pCAMBIA1301-dual-35S empty vector control, PmNAC32-OE1 and PmNAC32-OE2 N. tabacum lines. Bars in (D) = 10 cm. (E) Average bolting time of N. tabacum (OE lines and pCAMBIA-1301 lines) shown in (D). Values are indicated as mean ± SE (n = 15). (F) The expression level of PmNAC32 in PmNAC32-OE lines were assessed by qRT-PCR. Values are indicated as mean ± SE (n = 3). n/a means not applicable. (G) GUS staining of WT and PmNAC32-OE P. mume calli. (H), (I), and (J) The expression levels of PmNAC32, PmCOL4, and PmCOL5 in PmNAC32-OE lines were assessed by qRT-PCR. Values are indicated as mean ± SE (n = 3). Stars above the bars show significant differences by Student’s test (***P < 0.001; ****P < 0.0001).
Figure 4
Figure 4
PmNAC32 is the target gene of PmRVE1/3. (A) and (B) Interactions of PmRVE1 and PmRVE3 with the PmNAC32pro (EE) were detected in Y1H, respectively. AD represents the negative control. (C) and (D) The transcriptional regulation of the PmNAC32pro by PmRVE1 was investigated using the D-LUC assay. (E) and (F) The transcriptional regulation of the PmNAC32pro by PmRVE3 was investigated using the D-LUC assay. Luminescence signals were recorded by a CCD imaging system, and the pseudo-color bar illustrates the intensity scale. Empty vector pCAMBIA-1301 is the negative control, and values are indicated as mean ± SE (n = 3). Student’s test identified significant differences from the control (**P < 0.01). (G) and (H) His-PmRVE1 and His-PmRVE3 fusion proteins can bind EE-box in the PmNAC32pro. (I) and (J) His-PmRVE1 and His-PmRVE3 fusion proteins can bind CBS-box in the PmNAC32pro. 5’ FAM-labeled DNA probes were used. Same but unlabeled DNA probes were used as competitors, different but unlabeled DNA probes were used as mutators.
Figure 5
Figure 5
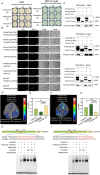
PmNAC32 directly bind the promoters of PmCOL4 and PmCOL5. (A) and (B) Interactions of PmNAC32 with the PmCOL4 and PmCOL5 promoter were detected in Y1H, respectively. AD represents the negative control. (C) and (D) D-LUC experiments were performed with PmNAC32 protein and PmCOL4 promoter. (E) and (F) D-LUC experiments were performed with PmNAC32 protein and PmCOL5 promoter. The empty vector pCAMBIA-1301 is the negative control, and values are indicated as mean ± SE (n = 3). Student’s test identified significant differences from the control (**P < 0.01; ***P < 0.001). (G) and (H) His-PmNAC32 fusion protein can bind 4E1 and 5E1 in the PmCOL4 and PmCOL5 promoter. 5’ Biotin-labeled DNA probes were used. Same but unlabeled DNA probes were used as competitors. Different but unlabeled DNA probes were used as mutators. Luminescence signals were recorded by a CCD imaging system, and the pseudo-color bar illustrates the intensity scale.
Figure 6
Figure 6
Overexpression of PmCOL4 and PmCOL5, influences flowering time in A. thaliana under LD conditions. (A) Flowering time phenotype of 35-day-old WT, PmCOL4-OE1, PmCOL4-OE2, and PmCOL4-OE3. Bars in (A) = 5 cm. (B) Average bolting time of A. thaliana (OE lines and WT) shown in (A). Values are indicated as mean ± SE (n = 15). (C) Average number of leaves of A. thaliana (OE lines and WT). Values are indicated as mean ± SE (n = 15). (D) Flowering time phenotypes of 27-day-old plants of the WT, PmCOL5-OE1, PmCOL5-OE2, and PmCOL5-OE3. Bars in (D) = 5 cm. (E) Average bolting time of A. thaliana (OE lines and WT) shown in (D). Values are indicated as mean ± SE (n = 15). (F) Average number of leaves of A. thaliana (OE lines and WT). Values are indicated as mean ± SE (n = 15). Stars above the bars show significant differences by Student’s test (***P < 0.001; ****P < 0.0001).
Figure 7
Figure 7
Analysis of expression patterns and LD phenotype of PmNAC29 and PmNAC47. (A) and (B) The transcriptional pattern of PmNAC29 and PmNAC47 does not respond to the varying photoperiod. The x-axis indicates the temporal point of sampling, and white and black rectangles represent the photoperiod (light and dark phases). Values are indicated as mean ± SE (n = 3). (C) and (D) qRT-PCR analysis of PmNAC29 and PmNAC47 in different tissues at different periods. Values are indicated as mean ± SE (n = 3). (E) Flowering time phenotype of 28-day-old WT and PmNAC29-OE lines. Bars in (E) = 5 cm. (F) Average bolting time of wild-type plants and PmNAC29-OE lines. Values are indicated as mean ± SE (n = 15). (G) Average number of leaves of A. thaliana (OE lines and WT). Values are indicated as mean ± SE (n = 15). (H) Flowering time phenotype of 29-day-old WT and PmNAC47-OE lines. Bars in (H) = 5 cm. (I) Average bolting time of wild-type plants and PmNAC47-OE lines. Values are indicated as mean ± SE (n = 15). (J) Average number of leaves of A. thaliana (OE lines and WT). Values are indicated as mean ± SE (n = 15). Stars above the bars show significant differences by Student’s test (ns > 0.05; *P < 0.05; **P < 0.01; ***P < 0.001; ****P < 0.0001). Statistical significance was determined using ANOVA. Different letters indicate statistically significant differences (P < 0.05)
Figure 8
Figure 8
PmNAC32, PmNAC29, and PmNAC47 interact with each other. (A) Analysis of interactions between PmNAC32, PmNAC29, and PmNAC47 by Y2H. (B) BiFC assay. YFP: images obtained through the YFP fluorescence channel; DAPI: images obtained through the DAPI channel; Bright: images obtained through bright light; Merged: composite overlay images; bars = 100 μm. (C) Pull-down assays. His empty vector, MBP-PmNAC29, and MBP-PmNAC47 were used as controls. The arrows showed the target protein locations. (D) and (E) D-LUC experiments were performed with the complex and PmCOL4 promoter. (F) and (G) D-LUC experiments were performed with the complex and PmCOL5 promoter. The empty vector pCAMBIA-1301 is the negative control, and values are indicated as mean ± SE (n = 3). Student’s test identified significant differences from the control (**P < 0.01; ***P < 0.001, ****P < 0.0001). (H) and (I) The complex can bind 4E1 and 5E1 in PmCOL4 and PmCOL5 promoters more strongly. 5’ Biotin-labeled DNA probes were used. Same but unlabeled DNA probes were used as competitors. Different but unlabeled DNA probes were used as mutators.
Figure 9
Figure 9
PmNAC32 homologous proteins AT3G12910 and AtJUB1 and their rhythmic expression patterns (A) Phylogenetic and evolutionary analysis of PmNAC32 homologous proteins in rice, Arabidopsis and Rosaceae family. Iqtree software is used to build Maximum-likelihood tree based on JTT + F + I + G4 model with a boostrap of 1000. The homologous sequence XP 015628846.1 of monocotyledonous rice was taken as outgroup, and all sequences were derived from the NCBI database. The percentage of trees where related taxa are clustered together is shown next to the branches. (B) The amino acid sequences of PmNAC32, AT3G12910, and AtJUB1 were aligned by Clustal X program. The amino acid residues conserved among the proteins are highlighted in black. The different amino acid residues are indicated with an asterisk*. The frame indicated the conserved NAM domain. (C) AtTOC1 (D) AtJUB1 (E) AT3G12910. The impact of photoperiod on transcriptional activity was evaluated by qRT-PCR. Values are indicated as mean ± SE (n = 3).
Figure 10
Figure 10
The model diagram illustrates that PmNAC32 responds to photoperiod signals and promotes floral bud differentiation in P. mume through the PmRVE1/3-PmNAC32-PmCOL4/5 transcriptional cascade from June to September, as daylight duration gradually shortens.

References

    1. Bäurle I, Dean C. The timing of developmental transitions in plants. Cell. 2006;125:655–64 - PubMed
    1. Putterill J, Laurie R, Macknight R. It’s time to flower: the genetic control of flowering time. BioEssays. 2004;26:363–73 - PubMed
    1. Srikanth A, Schmid M. Regulation of flowering time: all roads lead to Rome. Cell Mol Life Sci. 2011;68:2013–37 - PMC - PubMed
    1. Tan F-C, Swain SM. Genetics of flower initiation and development in annual and perennial plants. Physiol Plant. 2006;128:8–17
    1. Kaur A, Maness N, Ferguson L. et al. Role of plant hormones in flowering and exogenous hormone application in fruit/nut trees: a review of pecans. Fruit Res. 2021;1:1–9

LinkOut - more resources