. 2025 Aug 1:8:0762.
doi: 10.34133/research.0762. eCollection 2025.

CCN5 Drives Leydig Cell Aging and Testicular Dysfunction: Insights into Fibrosis, Lipid Dysregulation, and Therapeutic Potential

Affiliations

CCN5 Drives Leydig Cell Aging and Testicular Dysfunction: Insights into Fibrosis, Lipid Dysregulation, and Therapeutic Potential

Xiaoli Tan et al. Research (Wash D C). .

Abstract

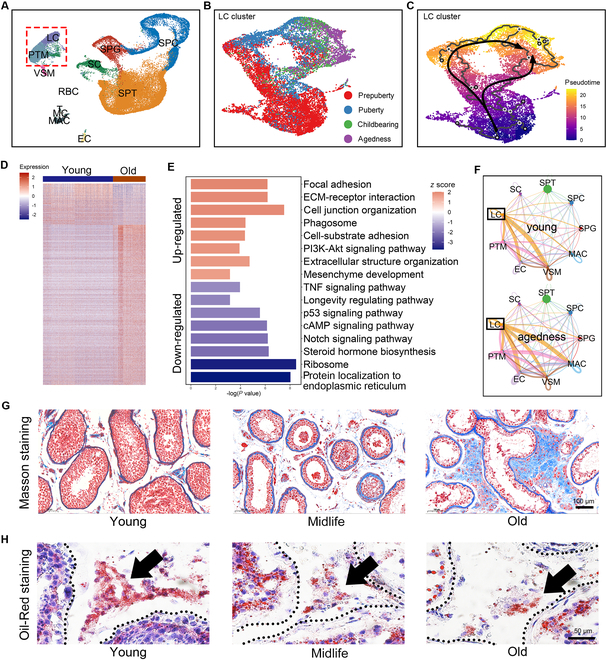
Leydig cells' (LCs') senescence is an important reason for the decline of testicular function in elderly men. Cellular communication network factor 5 (CCN5) regulates lipid metabolism and cellular fibrosis through multiple mechanisms. However, its role in LCs' aging and the underlying molecular mechanisms remain unclear. This study aimed to elucidate the effects and molecular mechanisms by which CCN5 drives aging phenotypes in LCs and to evaluate the potential of targeting CCN5 as a therapeutic strategy for testicular aging. CCN5 expression was located in LCs and elevated in aged testis. Overexpression of CCN5 led to LCs' aging and testis dysfunction. Extracellularly, CCN5 activated β-catenin and SMAD2/3 phosphorylation, promoting the expression of fibrosis-related genes. Intracellularly, CCN5 did not affect de novo cholesterol synthesis-related genes but changed the balance of cholesterol transporters. CCN5 bound to and reduced ring finger protein 213 (RNF213) protein levels. RNF213 knockdown activated forkhead box O, p16, and p21, resulting in SA-β-gal activation, reduced cell proliferation, and lipid droplet loss. In aged mice, CCN5 knockdown improved testicular atrophy, restored lipid droplet content and testosterone synthesis, and enhanced physical endurance and sexual behavior. In summary, CCN5 drives LCs' aging and testicular dysfunction maybe via promoting fibrosis and lipid droplet loss. Targeting CCN5 offers a promising strategy to treat testicular aging and associated reproductive endocrine disorders.


Conflict of interest statement

Competing interests: The authors declare that they have no competing interests.

Figures

Fig. 1.
Fig. 1.
The overall characteristics of testicular microenvironmental aging. (A) Uniform manifold approximation and projection (UMAP) plots of all testis cells from different age groups. Cells are colored according to their cell types. (B and C) UMAP plot of LC cluster. Cells are colored according to their (B) age group or (C) pseudotime. (D) Heatmap of the DEGs between LCs from the young and old group. (E) GSEA terms are shown as bar plot. The P value is presented on the x-axis, and the gradient from dark blue to orange indicates low to high GSEA score. (F) Circle plots showing the cell–cell communication network within the young (top panel) and old (bottom panel) testis microenvironment. The thickness of the line represents the signal strength, and the color of the line represents the resource cell of the signal. (G) Masson's staining of human testis tissue paraffin sections from different age groups. The scale bar represents 100 μm. (H) Red oil staining of human testis tissue paraffin sections from different age groups. The arrow points to the testicular interstitial area where LCs are located. The scale bar represents 50 μm.
Fig. 2.
Fig. 2.
CCN5 was significantly up-regulated in aged LCs. (A) The Venn diagram shows the intersection of 3 gene sets. (B) This table shows the functional classification of these intersecting genes. (C and D) The violin plot shows the expression of CCN5 across different types of testicular cells (C), or in LCs from different age groups (D). (E) qPCR results showing the expression fold change of some ECM genes in young and old LC. n = 3 technical repetitions. (F) Immunofluorescence staining of CCN5 in testicular paraffin sections from different age groups. Red and white arrows mark the testis interstitial and peritubular regions of the seminiferous tubules, respectively. The scale bar represents 50 μm. The right panel shows the fluorescence intensity statistics. n = 5 regions. (G) Immunofluorescence of CCN5 in cultured LCs from young and old testis. The scale bar represents 10 μm. n = 30 cells. (H) Western blot of CCN5 protein of LCs from young and old testis.
Fig. 3.
Fig. 3.
CCN5 overexpression leads to LC senescence and a decline in testicular function. (A) Western blot shows the CCN5 protein level of LCs before and after transfected with CCN5 overexpression or control plasmids. (B) SA-β-gal staining of LCs transfected with CCN5 overexpression or control plasmids. The scale bar represents 10 μm. n = 4 technical repetitions. (C) CCK-8 assay shows the proliferation of LCs transfected with CCN5 overexpression or control plasmids. n = 5 technical repetitions. (D) Flow cytometry demonstrated the influence of LCs transfected with CCN5 overexpression or control plasmids on the early (Q4) and late apoptosis (Q2) of LCs. The existence of Annexin V (x-axis) and the nuclear staining of PI (y-axis) by flow cytometry were shown. n = 3 technical repetitions. (E) Schematic illustration of the experimental workflow in vivo. (F) Immunofluorescence staining of CCN5 in testis after injection with CCN5-AAV9 or vector. The scale bar represents 100 μm. The right panel shows the fluorescence intensity statistics. n = 5 biological independent samples. (G) Testis after injection with CCN5-AAV9 showed a lower testis/body weight index. n = 5 biological independent samples. (H) ELISA results showing the testosterone concentration in the supernatant of cultured LC. n = 5 biological independent samples. (I) PAS staining of testis after injection with CCN5-AAV9 or vector. Asterisks indicate severely atrophied and degenerated seminiferous tubules. The scale bar represents 200 μm. (J) SA-β-gal staining of testis after injection with CCN5-AAV9 or vector. The scale bar represents 100 μm. n = 5 biological independent samples. (K) Immunofluorescence staining of CYP11A1 (LCs marker), SOX9 (SC marker), or DDX4 (germ cell marker) in testis after injection with CCN5-AAV9 or vector. The scale bar represents 200 μm. n = 5 biological independent samples. (L) The rotarod is used to assess endurance in mice. n = 5 biological independent samples. (M and N) Sexual behaviors including sniffing (M) and mating (N) in mice injection with CCN5-AAV9 or vector. n = 5 biological independent samples.
Fig. 4.
Fig. 4.
CCN5 induces different changes in LC phenotypes through intracellular and extracellular pathway. (A) Schematic diagram of the experimental grouping and treatment in this section. (B) SA-β-gal staining of LCs with CCN5(ΔSP) overexpression or recombinant CCN5 protein incubation. The scale bar represents 10 μm. n = 5 technical repeats. (C) CCK-8 assay shows the proliferation of LCs with CCN5(ΔSP) overexpression or recombinant CCN5 protein incubation. (D) The Venn diagram shows the overlap of up-regulated (left panel) or down-regulated (right panel) genes in the CCN5(ΔSP) overexpression and recombinant CCN5 protein treatment groups. (E) Volcano plot shows the DEGs in the CCN5(ΔSP) overexpression (left panel) and recombinant CCN5 protein treatment groups (right panel). (F) Bar plot showing the GSEA (KEGG pathways) terms according to the DEGs of LCs after CCN5(ΔSP) overexpression or recombinant CCN5 protein incubation.
Fig. 5.
Fig. 5.
Extracellular incubation with recombinant CCN5 protein induces a fibrotic phenotype in LCs. (A) UMAP plots of LC cluster. Cells are colored according to the expression level of specific gene. (B) Masson's staining of mice testis tissue transfected with CCN5 overexpression or control plasmids. The scale bar represents 50 μm. (C) Western blot shows the dynamic change of α-SMA (ACTA2) protein in LCs after recombinant CCN5 protein incubation. n = technical repeats. (D) Heatmap shows the expression pattern of WNT signal related genes in LCs with CCN5(ΔSP) overexpression or recombinant CCN5 protein incubation. Genes with significant change are listed. Statistical analysis made by 2-tailed, ANOVA test; the confidence interval is 95%. (E) Immunofluorescence of β-catenin in cultured LCs with CCN5(ΔSP) overexpression, CCN5(wt) overexpression, or recombinant CCN5 protein incubation. The bottom panel is a local magnification of the top panel. The scale bar represents 10 μm (bottom panel) and 20 μm (top panel). n = 15 cells. (F) GSEA with the DEGs of LCs after recombinant CCN5 protein incubation. (G) Western blot shows the dynamic change of SMAD signal proteins in LCs after recombinant CCN5 protein incubation. n = technical repeats. (H) Western blot shows the expression level of SMAD signal proteins in LCs with or without recombinant CCN5 protein incubation and XAV939.
Fig. 6.
Fig. 6.
Overexpression of CCN5(ΔSP) disrupts cholesterol metabolism in LCs. (A) Nile red staining of mice testis tissue transfected with CCN5 overexpression or control plasmids. The scale bar represents 20 μm or 50 μm. n = 5 biological independent samples. (B) Immunofluorescence of β-catenin in cultured LCs with CCN5(ΔSP) overexpression, CCN5(wt) overexpression, or recombinant CCN5 protein incubation. The scale bar represents 10 μm. (C) Immunofluorescence co-staining of Mitotracker (red), phalloidin (green), and filipin (blue) in cultured LCs with CCN5(ΔSP) overexpression or recombinant CCN5 protein incubation. The scale bar represents 10 μm. n = 15 cells. (D) GSEA of “cholesterol metabolism” and volcano plot of “cholesterol biosynthetic process” term depend on the DEGs of LCs with CCN5(ΔSP) overexpression. (E) GSEA of “ABC transporters” and volcano plot of “cholesterol transport” term depend on the DEGs of LCs with CCN5(ΔSP) overexpression. (F) Schematic representation of cellular cholesterol uptake and efflux. (G) Western blot shows the expression of cholesterol transporters in LCs with CCN5(ΔSP) overexpression, CCN5(wt) overexpression or recombinant CCN5 protein incubation. n = 3 technical repeats.
Fig. 7.
Fig. 7.
CCN5 promotes LCs senescence by down-regulating RNF213. (A) This table shows the top 10 proteins that combined with CCN5 identified by LC-MS/MS. (B) Bar plot shows the enrichment analysis of proteins that combined with CCN5. (C) The LCs (top panel) and 293t (bottom panel) cells lysates were immunoprecipitated by anti-FLAG antibody (fused with CCN5) or IgG with protein A/G magnetic beads. The precipitated proteins were analyzed by Western blot using anti-DOCK7 and anti-RNF213 antibody, respectively. (D) Immunofluorescence co-staining of RNF213 (red) and CCN5 (green) in young and old mice testis. The scale bar represents 100 μm. n = 10 different regions. (E) Scatter plot showing the correlation between CCN5 and RNF213 expression levels in the testicular interstitial region. (F) Western blot shows the level of RNF213 in LCs after recombinant CCN5 protein with CCN5(ΔSP) or CCN5(wt) overexpression. n = 3 technical repeats. (G) Western blot analysis to validate the knockdown efficiency of RNF213 in LCs. n = 3 technical repeats. (H) Western blot shows the fold change of FOXO1, FOXO3, p16, and p21 in LCs after knockdown of RNF213. n = 3 technical repeats. (I) ELISA was used to measure the change of testosterone concentration in the culture supernatant of LCs after knockdown of RNF213. n = 3 technical repeats. (J) SA-β-gal staining of LCs with RNF213 knockdown. The scale bar represents 20 μm. n = 5 technical repeats. (K) Crystal violet staining marks colony formation in LCs with RNF213 knockdown. n = 2 technical repeats. (L) Oil red staining of LCs with RNF213 knockdown. The scale bar represents 10 μm. n = 10 cells.
Fig. 8.
Fig. 8.
Knockdown of CCN5 in vivo alleviates age-related testicular degeneration in aged mice. (A) Schematic illustration of the experimental workflow in vivo. (B) Immunofluorescence staining of CCN5 in testis after injection with shRNA of CCN5 or scramble. The scale bar represents 100 μm (bottom panel) or 200 μm (top panel). n = 10 regions of 5 biological independent samples. (C) Photograph of aged mice after testicular injection of shRNA-AAV. (D) The body weight of aged mice after testicular injection of shRNA-AAV. n = 5 biological independent samples. (E) Photograph of testis from aged mice after testicular injection of shRNA-AAV. Testis/body weight index data from 5 biological independent samples. (F) PAS staining of testis from aged mice after testicular injection of shRNA-AAV. The scale bar represents 200 μm. (G) SA-β-gal staining of testis from aged mice after testicular injection of shRNA-AAV. The scale bar represents 100 μm. n = 5 biological independent samples. (H) Nile red staining of mice testis tissue after injection with shRNA-AAV of CCN5 or scramble. The scale bar represents 50 μm. n = 5 biological independent samples. (I and J) Immunofluorescence staining of (I) CYP11A1 (LCs marker) or (J) DDX4 (germ cell marker) in testis after injection with shRNA-AAV of CCN5 or scramble. The scale bar represents (I) 50 μm or (J) 100 μm. n = 5 biological independent samples. (K) ELISA results showing the testosterone concentration in the testicular tissue homogenate from aged mice after testicular injection of shRNA-AAV. n = 5 biological independent samples. (L) The rotarod is used to assess endurance in mice. n = 5 biological independent samples. (M and N) Sexual behaviors including sniffing (M) and mating (N) in mice after injection with shRNA-AAV or scramble. n = 5 biological independent samples.

References

    1. Wu FC, Tajar A, Beynon JM, Pye SR, Silman AJ, Finn JD, O’Neill TW, Bartfai G, Casanueva FF, Forti G, et al. Identification of late-onset hypogonadism in middle-aged and elderly men. N Engl J Med. 2010;363(2):123–135. - PubMed
    1. Yang H, Chryssikos T, Houseni M, Alzeair S, Sansovini M, Iruvuri S, Torigian DA, Zhuang H, Dadparvar S, Basu S, et al. The effects of aging on testicular volume and glucose metabolism: An investigation with ultrasonography and FDG-PET. Mol Imaging Biol. 2011;13(2):391–398. - PubMed
    1. Lasiene K, Gasiliunas D, Juodziukyniene N, Dabuzinskiene A, Vitkus A, Zilaitiene B. Age-related morphological peculiarities of human testes. Folia Morphol (Warsz). 2021;80(1):122–126. - PubMed
    1. Alfano M, Tascini AS, Pederzoli F, Locatelli I, Nebuloni M, Giannese F, Garcia-Manteiga JM, Tonon G, Amodio G, Gregori S, et al. Aging, inflammation and DNA damage in the somatic testicular niche with idiopathic germ cell aplasia. Nat Commun. 2021;12(1):5205. - PMC - PubMed
    1. Zhao L-Y, Li P, Yao CC, Tian RH, Tang YX, Chen YZ, Zhou Z, Li Z. Low XIST expression in Sertoli cells of Klinefelter syndrome patients causes high susceptibility of these cells to an extra X chromosome. Asian J Androl. 2023;25(6):662–673. - PMC - PubMed