. 2025 Sep 1;6(3):035005.
doi: 10.1088/2632-072X/adf2ed. Epub 2025 Aug 1.

Quantifying edge relevance for epidemic spreading via the semi-metric topology of complex networks

Affiliations

Quantifying edge relevance for epidemic spreading via the semi-metric topology of complex networks

David Soriano-Paños et al. J Phys Complex. .

Abstract

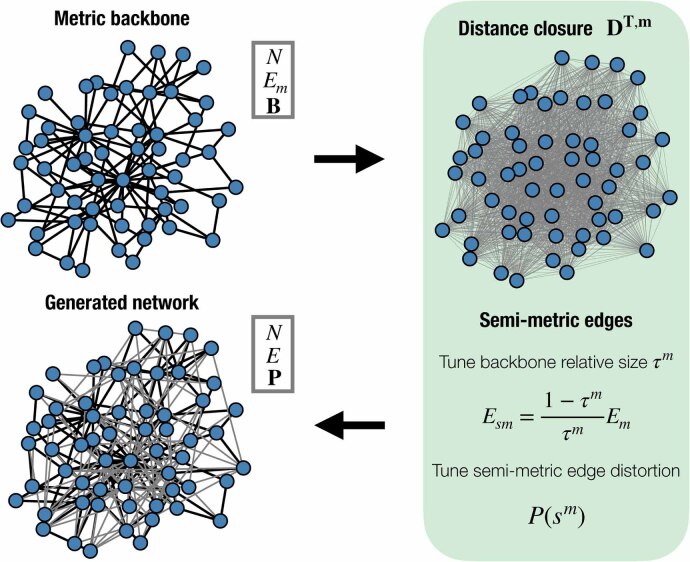
Sparsification aims at extracting a reduced core of associations that best preserves both the dynamics and topology of networks while reducing the computational cost of simulations. We show that the semi-metric topology of complex networks yields a natural and algebraically-principled sparsification that outperforms existing methods on those goals. Weighted graphs whose edges represent distances between nodes are semi-metric when at least one edge breaks the triangle inequality (transitivity). We first confirm with new experiments that the metric backbone-a unique subgraph of all edges that obey the triangle inequality and thus preserve all shortest paths-recovers susceptible-infected dynamics over the original non-sparsified graph. This recovery is improved when we remove only those edges that break the triangle inequality significantly, i.e. edges with large semi-metric distortion. Based on these results, we propose the new semi-metric distortion sparsification method to progressively sparsify networks in decreasing order of semi-metric distortion. Our method recovers the macro- and micro-level dynamics of epidemic outbreaks better than other methods while also yielding sparser yet connected subgraphs that preserve all shortest paths. Overall, we show that semi-metric distortion overcomes the limitations of edge betweenness in ranking the dynamical relevance of edges not participating in any shortest path, as it quantifies the existence and strength of alternative transmission pathways.

Keywords: distance backbone; epidemic dynamics; network sparsification; semi-metric distortion.


Figures

Figure 1.
Figure 1.
Schematic representation of the construction of synthetic networks with tunable relative size of the backbone τm and semi-metric distortion distribution P(sm). The first step consists of setting the (connected) metric backbone of a synthetic network. This metric backbone is fully characterized by the number of nodes N, the number of edges Em and the proximity matrix B containing the weights of associations. The next step involves computing the distance closure matrix DT,m, a graph of the same node set N, whose edge weights denote the shortest distance (length of shortest path) between every pair of nodes. Finally, we generate a synthetic network by adding Esm edges, whose value is computed according to equation (7) in the Methods section, to obtain a desired relative backbone size τm. The semi-metric distortion values of the added edges sijm are drawn from the target distribution P(sm). Finally, the resulting proximity matrix P is obtained by applying equations (3) and (6) in Methods section to each sijm value.
Figure 2.
Figure 2.
Panel (a): ratio between the time for the disease to reach half the population in the metric backbone and in the constructed network ξ1/2B as a function of the parameter µ, i.e. the logarithm of the median of the semi-metric distortion distribution, and the relative size of the backbone τm (color code). For a given seed, we compute the time to reach half the population t1/2 as the median value observed across 200 realizations of the SI dynamics. Dots show the average and error bars represent the standard deviation of the ratios obtained for 50 different infectious seeds. Panel (b): average time of infection of each individual i in the metric backbone tiB as a function of its average time of infection in the entire network ti for different values of the relative size of the backbone τm (color code). These results are obtained by averaging 200 realizations starting from the same initial seed. In both panels, we set β = 0.5 for the SI dynamics, fix σ = 1 in the semi-metric distortion distribution and consider the metric backbone B of a network capturing face-to-face interactions in a elementary school in the US [47].
Figure 3.
Figure 3.
Ratio between the time for the disease to reach half the population in the sparsified network and in the original synthetic network ξ1/2x as function of the parameter governing the size of the sparsified network χ for each sparsification method x (color code). χ ranges from χ = 1, corresponding to not removing any edge, to χ = 0 where Esm edges are removed. Three different sparsification methods are compared: targeting edges with highest semi-metric distortion values (SMDS), lowest effective resistance values (EffRes) or lowest proximity values (W). The details of the simulations to obtain the ratios are the ones described for figure 2(a). EffRes and W curves are interrupted when breaking the largest connected component of the network. Insets: Number of components in the network as a function of the edges removed χ and the sparsification method (color code). The horizontal dashed line represents the SMDS, which always preserves the largest connected component. The original synthetic networks are constructed considering τm=0.1 and µ = 1 (panel (a)) or µ = 2 (panel (b)) respectively.
Figure 4.
Figure 4.
Panel (a): ratio between the time for the disease to reach half the population in the sparsified network and in the original synthetic network ξ1/2x as a function of the parameter χ, governing the edges removed from the network, and the sparsification method x (color code). The contact network corresponds to face-to-face interactions recorded in an elementary school students (kindergarten to sixth grade) in Utah (USA) [47]. The details of the simulations to obtain the ratios are the ones described for figure 2(a). Panel (b): distribution of the relative difference Δξ~1/2x between the mean ratio associated to each sparsification method x (color code) and SMDS as a function of the size of the sparsified network χ, for all emprical networks. Positive Δξ~1/2x values reveal a better performance of SMDS with respect to the sparsification method x. Dots represent each of the 16 networks included in the dataset under study whereas solid lines show the median Δξ~1/2x value observed across networks for each sparsification method x. Panel (c): fraction of disconnected networks in the dataset of real networks fx as a function of the size of the sparsified network χ and the sparsification method x (color code). In panels (b) and (c), the horizontal dashed line represents the values obtained for the SMDS.

Similar articles

References

    1. Keeling M J, Eames K T D. J. R. Soc. Interface. 2005;2:295. doi: 10.1098/rsif.2005.0051. - DOI - PMC - PubMed
    1. Morris M. Network Epidemiology: A Handbook for Survey Design and Data Collection. Oxford University Press; 2004.
    1. Metcalf C J E, Morris D H, Park S W. Science. 2020;369:368. doi: 10.1126/science.abd1668. - DOI - PubMed
    1. Pagel C, Yates C A. BMJ. 2022;378:e070615. doi: 10.1136/bmj-2022-070615. - DOI - PubMed
    1. Blondel V D, Decuyper A, Krings G. EPJ Data Sci. 2015;4:1. doi: 10.1140/epjds/s13688-015-0046-0. - DOI

LinkOut - more resources