. 2025 Jul 17;10(29):31776-31788.
doi: 10.1021/acsomega.5c02807. eCollection 2025 Jul 29.

The Role of c‑Jun Signaling in Cytidine Analog-Induced Cell Death in Melanoma

Affiliations

The Role of c‑Jun Signaling in Cytidine Analog-Induced Cell Death in Melanoma

Shayne Sensenbach et al. ACS Omega. .

Abstract

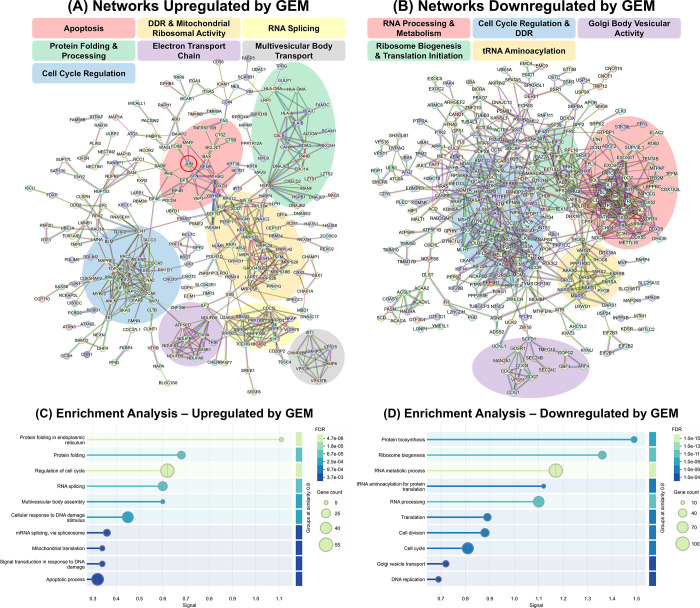
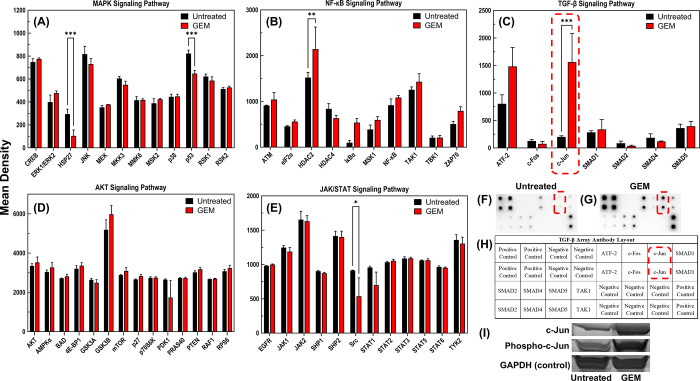
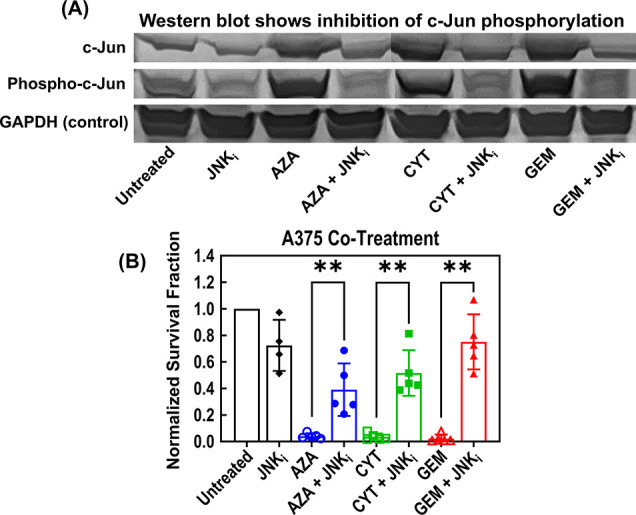
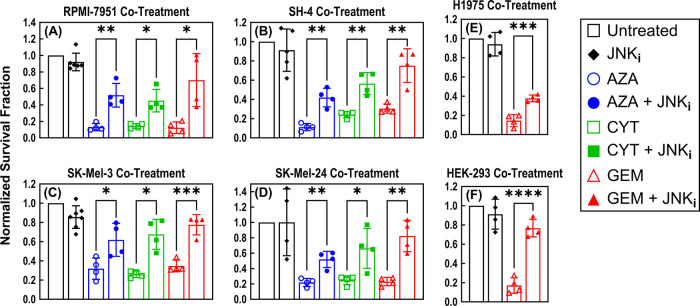
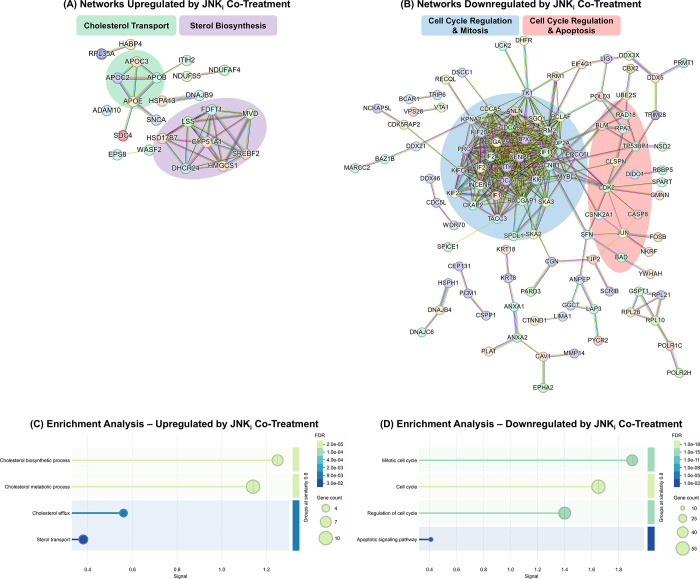
Melanoma stands as an increasingly pressing health concern. Enhanced mitochondrial metabolism has been reported in melanoma cells that survived treatment with traditional therapeutics, including cytidine analogs like gemcitabine (GEM). These findings suggest that chemotherapeutic drugs may play dual roles in promoting both cell survival and cell death, although the underlying mechanisms require further investigation. Herein, we conducted proteomics analysis on GEM-treated melanoma cells and found a drug-induced activation of DNA damage response and apoptosis, along with cell cycle arrest. Additionally, GEM treatment significantly altered protein networks related to mitochondrial ribosomal activity, the electron transport chain, and translation. Furthermore, we reported an upregulation of the JNK/c-Jun network in connection with the apoptotic proteins. Co-treatment with a Jun N-terminal Kinase (JNK) inhibitor, JNK-IN-8 (JNKi), significantly increased cell survival, suggesting the involvement of c-Jun signaling in GEM-induced cell death. Additionally, proteomics analysis revealed that JNKi downregulated apoptosis in cotreated cells, highlighting the potential role of the JNK/c-Jun network inhibition in chemotherapeutic tolerance. Collectively, our findings bridge gaps in understanding how melanoma cells respond to cytidine analogs by demonstrating the multifaceted effects of these agents in (1) inducing JNK-mediated apoptotic cell death and (2) promoting a state of cell cycle inhibition.


Figures

1
1
Untargeted proteomics analysis of A375 cells. Changes in protein expression were assessed upon 24 h of treatment with 20 nM gemcitabine (GEM). (A-B) Protein networks which were significantly (P < 0.01) (A) upregulated and (B) downregulated upon GEM treatment. Untreated and treated cells were collected after 24 h, and LC-MS was used to quantify differences in protein expression between the two groups. STRING was used to depict networks of interacting proteins, indicating altered cellular activities. Significantly changed protein networks are highlighted and described using a color code. The JUN protein (i.e., c-Jun) is highlighted with a red circle in the apoptotic subnetwork. (C–D) Visualization of functional enrichment in the proteins which were (C) upregulated and (D) downregulated by GEM treatment. The protein subnetworks or clusters identified in (A) and (B) were further analyzed through Gene Ontology Biological Process enrichment analysis and visualized in (C) and (D). Gene count: the number of proteins related to each term which were identified as upregulated or downregulated. FDR (False Discovery Rate): A measure of the significance of enrichment. P values are shown, corrected for multiple testing for each category with the Benjamini-Hochberg procedure. Signal: a weighted average between the ratio of observed vs expected proteins and -log­(FDR), balancing both these values and allowing intuitive sorting of enrichment values. N = 3.
2
2
Targeted analysis of protein expression and phosphorylation in A375 cells, comparing untreated cells to those treated with 20 nM gemcitabine (GEM) for 24 h. (A-E) Quantified levels of A375 protein phosphorylation in the MAPK, NF-κB, TGF-β, AKT, and JAK/STAT signaling pathways. Cell lysates were analyzed using immunodetection arrays which were printed with antibodies of interest. Increased phosphorylation of c-Jun is highlighted in red in (C). For (A-E), statistical significance was assessed using two-way ANOVA with Sidak’s multiple comparisons post hoc testing. (*P < 0.05, **P < 0.01, ***P < 0.001). N = 3. (F-G) Representative images of TGF-β immunodetection arrays which were incubated with lysates from untreated and GEM-treated cells. The detection areas corresponding to c-Jun are highlighted in red. (H) The layout of printed antibodies on the TGF-β immunodetection arrays, corresponding to the images in F and G. (I) Representative images of Western blot results, comparing c-Jun protein expression and phosphorylation (at Serine 73) in untreated and GEM-treated A375 cells. The Western blot loading control (GAPDH) is shown on the bottom row. N = 4.
3
3
Effects on A375 cells of cotreatment with cytidine analogs, AZA, CYT, and GEM, plus JNKi. See Table S2 for treatment concentrations. (A) Representative Western blot image comparing A375 cell lysates from cells treated under the indicated conditions for 24 h. The top row shows c-Jun protein levels, the middle row shows phosphorylated (Serine 73) c-Jun levels, and the bottom row shows GAPDH (loading control) protein levels. N = 4. (B) A375 survival fractions were measured with flow cytometry after 72 h of treatment under the indicated conditions and normalized to the untreated cell number. Pair-wise t tests were used to determine statistical significance. (**P < 0.01). N = 4 (or greater).
4
4
Co-treatment of multiple cell lines with cytidine analogs, AZA, CYT, and GEM, plus JNKi. See Table S2 for treatment concentrations. (A-F) correspond to cotreatment of RPMI-7951, SH-4, SK-Mel-3, SK-Mel-24, H1975, and HEK-293, respectively. Survival fractions were measured by flow cytometry after 72 h of treatment under the indicated conditions and normalized to the untreated cell number. Pair-wise t tests were used to determine statistical significance. (*P < 0.05, **P < 0.01, ***P < 0.001, ****P < 0.0001). N = 4 (or greater).
5
5
Untargeted proteomics analysis of A375 cells. Changes in protein expression were assessed upon 24 h of treatment, comparing cotreatment with GEM plus JNKi to single GEM treatment. Treatment concentrations for GEM and JNKi were 20 nM and 5 μM, respectively. (A-B) Significantly (P < 0.01) (A) upregulated and (B) downregulated protein networks are presented similar to Figure . In this case, upregulated and downregulated protein networks are due to the addition of JNKi. (C–D) Visualization of functional enrichment in the proteins which were (C) upregulated and (D) downregulated by JNKi cotreatment. The protein subnetworks or clusters identified in (A) and (B) were further analyzed through Gene Ontology Biological Process enrichment analysis and visualized in (C) and (D). See Figure for descriptions of the terms in these figures. N = 3.

Similar articles

References

    1. Siegel R. L., Giaquinto A. N., Jemal A.. Cancer statistics, 2024. CA: Cancer J. Clin. 2024;74(1):12–49. doi: 10.3322/caac.21820. - DOI - PubMed
    1. Koolen P. G. L.. et al. Recurrence Rates Over 20 Years in the Treatment of Malignant Melanoma: Immediate Versus Delayed Reconstruction. Plast. Reconstr. Surg. Glob. Open. 2017;5(7):e1378. doi: 10.1097/GOX.0000000000001378. - DOI - PMC - PubMed
    1. Davis L. E., Shalin S. C., Tackett A. J.. Current state of melanoma diagnosis and treatment. Cancer Biol. Ther. 2019;20(11):1366–1379. doi: 10.1080/15384047.2019.1640032. - DOI - PMC - PubMed
    1. Helmbach H., Rossmann E., Kern M. A., Schadendorf D.. Drug-resistance in human melanoma. Int. J. Cancer. 2001;93(5):617–622. doi: 10.1002/ijc.1378. - DOI - PubMed
    1. Flaherty K. T.. Chemotherapy and Targeted Therapy Combinations in Advanced Melanoma. Clin. Cancer Res. 2006;12(7):2366s–2370s. doi: 10.1158/1078-0432.CCR-05-2505. - DOI - PubMed

LinkOut - more resources