. 2025 Sep;603(17):4723-4745.
doi: 10.1113/JP286444. Epub 2025 Aug 4.

5-HT7 antagonists confer analgesia via suppression of neurotrophin overproduction in submucosal nerves of mouse models with visceral hypersensitivity

Affiliations

5-HT7 antagonists confer analgesia via suppression of neurotrophin overproduction in submucosal nerves of mouse models with visceral hypersensitivity

Tzu-Yi Lee et al. J Physiol. 2025 Sep.

Abstract

Dysregulated serotonin/5-hydroxytryptamine (5-HT) metabolism and dense mucosal neurite distribution are associated with visceral hypersensitivity (VH), which plays a key role in irritable bowel syndrome (IBS) pain symptoms. The 5-HT receptor subtype 7 (5-HT7) is involved in neuroplasticity. We aim to investigate the analgesic effects of 5-HT7 antagonists in mouse models and explore downstream changes of nerve growth factor (NGF) and brain-derived neurotrophic factor (BDNF) in the enteric neurons. Selective 5-HT7 antagonists [CYY1005 (CYY), JNJ-18038683 (JNJ) or SB269970 (SB7)] were orogavaged to an IBS-like mouse model of postinflammatory VH after resolution from trinitrobenzene sulfonic acid-induced colitis. Visceromotor response, mucosal neurite outgrowth, and neurotrophin levels were assessed. Orogavage of CYY had stronger analgesic effects than JNJ or SB7 in the IBS-like mice. Higher density of 5-HT7-expressing mucosal nerve fibres was associated with increased NGF and BDNF immunostaining in the submucosal plexus of IBS-like mice compared to those of sham mice. No difference in the serotonergic neurons of spinal ganglia and brain regions was observed between IBS-like and sham mice. Moreover, CYY treatment for 10 days decreased the colonic neurotrophin levels and reduced pain sensation in IBS-like mice. Serotonin-induced neurite elongation was inhibited by 5-HT7 antagonists in mouse primary submucosal neuron cultures and human SH-SY5Y cell lines. Neutralizing antibodies to neurotrophins also diminished the serotonin-induced neurite outgrowth. Lastly, 5-HT7 activation upregulated neurotrophin expression in neurons via Cdk5/mTOR/Cdc42 signalling. In conclusion, 5-HT7 antagonists attenuated neurotrophin overproduction in the submucosal nerve plexus, leading to lesser mucosal innervation and reduced intestinal nociception in IBS-like mouse models. KEY POINTS: Aberrant serotonin/5-hydroxytryptamine (5-HT) metabolism and dense mucosal neurites are linked with irritable bowel syndrome (IBS) pain symptoms. Current treatments are ineffective for IBS pain management. Previous studies showed 5-HT receptor subtype 7 (5-HT7)-expressing nerve fibres in the colonoscopic biopsy of IBS patients and colonic mucosa of IBS-like mouse models. Moreover, 5-HT7 activation is involved in neuroplasticity in neural cell lines in vitro. Although visceral pain has been studied extensively in spinal afferents, the involvement of enteric neurons in intestinal nociception remains to be determined. Orogavage of 5-HT7 antagonist reduced mucosal neurite outgrowth and decreased neurotrophin overproduction in submucosal nerves, resulting in lower intestinal pain. Activation of 5-HT7 promotes neurite elongation in primary submucosal nerve cultures. The findings implicate a potential role of submucosal plexus in 5-HT7-dependent visceral hypersensitivity.

Keywords: colon hyperalgesia; enteric nervous system; irritable bowel syndrome; neuroendocrine; nociceptive afferent; primary neuron cultures; serotonergic nerve; submucosal plexus.


Conflict of interest statement

The authors declare that they have no competing interests.

Figures

Figure 1
Figure 1. Comparison of selective 5‐HT7 antagonists for analgesic effects in mouse models
A, timeline of the postinflammatory mouse model with visceral hypersensitivity. Mice were intracolonically injected with trinitrobenzene sulfonic acid (TNBS) for colitis induction or sham injected with an equal volume of saline (Sham). The visceromotor response (VMR) to colorectal distension is measured on day 24 post‐TNBS (PT) during the post‐colitis phase. The Sham and PT mice were administered 5 mg kg−1 CYY1005 (CYY), JNJ‐18 038 683 (JNJ), SB269970 (SB7) or PBS vehicle (veh) by orogavage 1.5 h before the VMR measurement. The colon was subjected to four cycles of 10 s distensions (15, 40 and 65 mmHg) by balloon inflation with 3 min rest intervals. B, the VMRs in the PT+veh mice were statistically higher than those in the Sham+veh mice. C, no difference in the VMR values of Sham mice administered CYY, JNJ or SB7 compared to those administered vehicles. D, treatment with CYY, JNJ or SB7 reduced the VMR values of PT mice. Data are expressed as the mean ± SD. Each dot represents the data of one mouse. N = 6–10 mice per group. *P < 0.05 vs. Sham+veh or PT+veh.
Figure 2
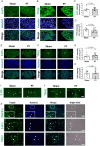
Figure 2. Increased density of 5‐HT7‐expressing neurites in the intestinal mucosa of PT mice
A, representative immunofluorescence images of PGP9.5 (green) merged with cell nuclei staining (blue) in colonic tissues of Sham and PT mice. The areas of the mucosa, submucosa (Sub), and the circular (CM) and longitudinal (LM) smooth muscles are marked by the white dotted lines. The PGP9.5‐positive nerve plexus in the submucosal layer is indicated by red arrows, and the nerve plexus between the CM and LM layers is labelled with a red asterisk (*). The white arrowheads in the lamina propria showed the PGP9.5‐positive nerve fibres in the gut mucosa. Scale bar  =50 µm. B and C, representative images of 5‐HT7 (green) and TPH2 (green) immunostaining in colonic tissues of Sham and PT mice. The immunofluorescence was merged with nuclear staining (blue) for tissue orientation. D, negative staining was observed by using an isotype control antibody on tissue sections. Scale bar = 50 µm. E, F and G, quantification of PGP9.5, 5‐HT7 and TPH2 intensity in the colonic mucosa of Sham and PT mice. Fluorescence intensity of a total of 30–40 images was quantified from six to 10 mice per group. Data are expressed as the mean ± SD. Each dot represents the intensity of one image. *P < 0.05.
Figure 3
Figure 3. Colocalization of PGP9.5 and 5‐HT7 staining on mucosal nerve fibres in PT mice
A, representative images for double staining of PGP9.5 and 5‐HT7. B, representative images for double staining of PGP9.5 and TPH2. The immunofluorescence of PGP9.5 staining (red) was superimposed on 5‐HT or TPH2 staining (green) in the merged images. The arrowheads indicate the colocalization of PGP9.5 with 5‐HT7 or TPH2 staining on mucosal nerve fibres (yellow colour in the merged images). The cell nuclei staining (blue) is shown for tissue orientation. Scale bar = 50 µm.
Figure 4
Figure 4. No change in the 5‐HT7 and TPH2 levels of the serotonergic neurons in the spinal ganglia and brain of PT mice
A and B, photoimages of dorsal root ganglia (DRG) corresponding to the region of the T11‐L1 spinal cord were stained for 5‐HT7 or TPH2 proteins (green). The immunofluorescence was merged with cell nuclei staining (blue) for tissue orientation. Scale bar = 50 µm. C and D, quantification of 5‐HT7 and TPH2 staining intensity on DRG sections. Data are expressed as the mean ± SD. Each dot represents the average intensity of seven images from one mouse for a total of 10 mice per group. E and F, photoimages of whole brain tissues stained for 5‐HT7 or TPH2 proteins (green), and merged with the nuclei (blue). The inset boxes (white) indicated the dorsal ralph nucleus (DRN) area for quantification of fluorescence intensity. The DRN area is defined by the anatomical location of Bregma −4.36 to −4.84 mm. Scale bar = 500 µm. G and H, Quantification of 5‐HT7 and TPH2 staining intensity in the DRN area. Data are expressed as the mean ± SD. Each dot represents the average intensity of three images from one mouse for a total of 10 mice per group. I and J, enlarged images of the insets of (E) and (F). K, immunostaining on primary mouse DRG cultures confirmed the presence of 5‐HT7 and TPH2 proteins in neurons and glia‐like cells. The neuron cell soma is indicated by arrows, nerve fibres are marked by arrowheads, and the glia‐like cells are labelled with an asterisk (*).
Figure 5
Figure 5. Treatment with CYY for 10 days attenuated visceral hypersensitivity and diminished intestinal neurotrophin expression in PT mice
A, timeline of daily treatment with CYY or vehicle for 10 days (qd × 10) in the Sham and PT mice. B, treatment with CYY (qd × 10) alleviated intestinal pain in the PT mice. Data are expressed as the mean ± SD. Each dot represents the VMR value of one mouse. N = 6–10 per group. C, quantitative PCR analysis showing increased Htr7, Ngf and Bdnf gene expression in mouse colonic tissues. CYY treatment (qd × 10) reduced the Htr7 and Bdnf levels in PT mice. Data are expressed as the mean ± SD. Each dot represents the gene expression of one mouse. N = 3–6 per group.
Figure 6
Figure 6. High levels of NGF and BDNF in the submucosal plexus of PT mice
The colonic tissues of sham and PT mice treated with CYY or vehicle for 10 days (qd × 10) were stained for neurotrophin proteins. A, representative immunofluorescence images of NGF (green) merged with cell nuclei staining (blue) in colonic tissues. Scale bar = 50 µm. B, insets show magnified images of NGF proteins localized to epithelia (*) and submucosal plexus (arrows). C, quantification results of NGF intensity per mucosal/submucosal area. D, representative immunofluorescence images of BDNF (green) merged with cell nuclei staining (blue) in colonic tissues. Scale bar = 50 µm. E, insets show magnified images of BDNF proteins localized to epithelia (*) and submucosal plexus (arrows). F, quantification results of BDNF intensity per mucosal/submucosal area. Fluorescence intensity of a total of 30–40 images was quantified from six to 10 mice per group. Data are expressed as the mean ± SD. Each dot represents the intensity of one image.
Figure 7
Figure 7. 5‐HT7‐dependent neurite elongation in primary cultures of submucosal plexus
A, representative images of PGP9.5 immunostaining in colonic tissues of the sham and PT mice treated with CYY or PBS vehicle for 10 days (qd × 10). The PGP9.5 staining (green) was superimposed on the cell nuclei staining (blue) in the merged images. The PGP9.5‐positive nerve plexus in the submucosal (Sub) layer is marked by red arrows, and the nerve plexus between the CM and LM layers is labelled with a red asterisk (*). The white arrowheads in the lamina propria showed the PGP9.5‐positive nerve fibres in the gut mucosa. Scale bar = 50 µm. B, quantification results of PGP9.5 intensity in mouse colonic mucosa. Fluorescence intensity of a total of 30–40 images was quantified from six to 10 mice per group. Data are expressed as the mean ± SD. Each dot represents the intensity of one image. C, representative images of (a) colon tissues with full thickness and (b) submucosal nerve plexus after the removal of mucosa and muscularis externa for primary culturing. The PGP9.5 staining (green) was merged with cell nuclei staining (blue) for tissue orientation. The labels are the same as above. D, enlarged images of the primary cultures show neurons with the morphology of Dogiel type I (efferent neurons) and Dogiel type II (afferent neurons). E, representative images of the bright field view and 5‐HT7 immunostaining (green) in the cell soma and nerve fibres of submucosal neurons, with or without 5‐HT stimulation. F, stimulation with serotonin (1 µm) induced longer neurite length in the submucosal neurons, and CYY (10 µm) inhibited the neurite extension. In total, 60–120 neurons in each group werwas quantified from two independent experiments. Data are expressed as the mean ± SD. Each dot represents the neurite length of one neuron.
Figure 8
Figure 8. Dose‐dependent inhibition of serotonin‐induced neurite outgrowth by 5‐HT7 antagonists in SH‐SY5Y cells
Human SH‐SY5Y neural cells were stimulated with serotonin (1 µm) in the presence of 5‐HT7 antagonists at various concentrations. A, representative bright field images of neurons. All doses of the 5‐HT7 antagonists were 10 µm. Scale bar = 50 µm. B, C and D, average neurite length in serotonin‐stimulated cells treated with various concentrations of CYY, JNJ or SB7. In total, 100–200 neurons in each group was quantified from two independent experiments. Data are expressed as the mean ± SD. Each dot represents the neurite length of one neuron. E, no difference in the IC50 values among the 5‐HT7 antagonists to reduce neurite length in vitro.
Figure 9
Figure 9. Serotonin/5‐HT7‐induced neurotrophin upregulation was dependent on Cdk5/mTOR/Cdc42 signalling in SH‐SY5Y cells
A, representative bright field images of the SH‐SY5Y cells stimulated with 1 µm serotonin and LP‐211 (a 5‐HT7 agonist). B, average neurite length in SH‐SY5Y cells after serotonin or LP‐211 stimulation. C, neutralizing antibodies to NGF and BDNF inhibited the serotonin‐induced nerve fibre elongation. In total, 100–200 neurons in each group was quantified from two independent experiments. Isotype antibodies were added to the culture medium as negative controls. Data are expressed as the mean ± SD. Each dot represents the neurite length of one neuron. D and E, signalling pathways of the serotonin‐induced upregulation NGF and BDNF gene expression. The SH‐SY5Y cells were stimulated with serotonin in the presence of pharmacological inhibitors, such as Y27632 (a ROCK inhibitor), NSC23766 (a Rac1 inhibitor), roscovitine (a Cdk5 inhibitor), rapamycin (a mTOR inhibitor) and ZCL278 (a Cdc42 inhibitor). N = 8–14 per group. F, representative images of PGP9.5, 5‐HT7, NGF and BDNF staining in SH‐SY5Y cells (green). Scale bar = 50 µm. G and H, quantification of the immunofluorescence intensity of NGF and BDNF in the cells after serotonin or LP‐211 stimulation. In total, 60–100 neurons in each group was quantified from two independent experiments. Data are expressed as the mean ± SD. Each dot represents the fluorescence intensity of one neuron.

Similar articles

References

    1. Ahrends, T. , Weiner, M. , & Mucida, D. (2022). Isolation of myenteric and submucosal plexus from mouse gastrointestinal tract and subsequent flow cytometry and immunofluorescence. Structured Transparent Accessible Reproducible Protocols, 3(1), 101157. - PMC - PubMed
    1. Akbar, A. , Yiangou, Y. , Facer, P. , Walters, J. R. , Anand, P. , & Ghosh, S. (2008). Increased capsaicin receptor TRPV1‐expressing sensory fibres in irritable bowel syndrome and their correlation with abdominal pain. Gut, 57(7), 923–929. - PMC - PubMed
    1. Andres, H. , Rock, R. , Bridges, R. J. , Rummel, W. , & Schreiner, J. (1985). Submucosal plexus and electrolyte transport across rat colonic mucosa. The Journal of Physiology, 364(1), 301–312. - PMC - PubMed
    1. Balemans, D. , Aguilera‐Lizarraga, J. , Florens, M. V. , Jain, P. , Denadai‐Souza, A. , Viola, M. F. , Alpizar, Y. A. , Van Der Merwe, S. , Vanden Berghe, P. , Talavera, K. , Vanner, S. , Wouters, M. M. , & Boeckxstaens, G. E. (2019). Histamine‐mediated potentiation of transient receptor potential (TRP) ankyrin 1 and TRP vanilloid 4 signaling in submucosal neurons in patients with irritable bowel syndrome. American Journal of Physiology‐Gastrointestinal and Liver Physiology, 316(3), G338‐G349. - PubMed
    1. Barbara, G. , Wang, B. , Stanghellini, V. , de Giorgio, R. , Cremon, C. , Di Nardo, G. , Trevisani, M. , Campi, B. , Geppetti, P. , Tonini, M. , Bunnett, N. W. , Grundy, D. , & Corinaldesi, R. (2007). Mast cell‐dependent excitation of visceral‐nociceptive sensory neurons in irritable bowel syndrome. Gastroenterology, 132(1), 26–37. - PubMed

MeSH terms

LinkOut - more resources