. 2025 Sep 23;99(9):e0092725.
doi: 10.1128/jvi.00927-25. Epub 2025 Aug 4.

Modeling of hepatitis B virus infection spread in primary human hepatocytes

Affiliations

Modeling of hepatitis B virus infection spread in primary human hepatocytes

Zhenzhen Shi et al. J Virol. .

Abstract

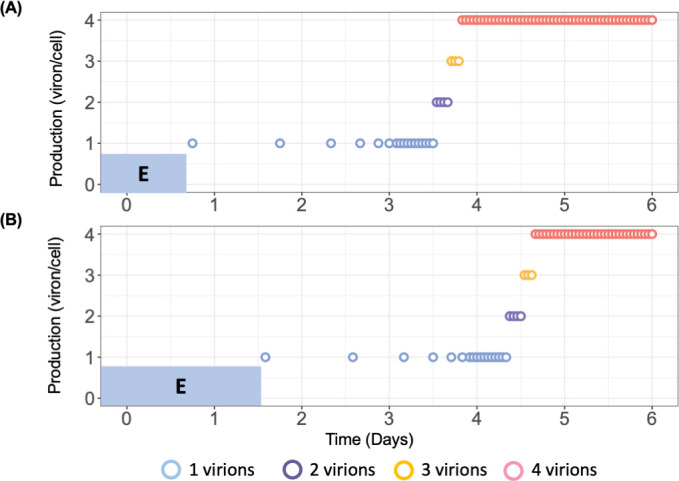
Chronic hepatitis B virus (HBV) infection poses a significant global health threat, causing severe liver diseases including cirrhosis and hepatocellular carcinoma. We characterized HBV DNA kinetics in primary human hepatocytes (PHHs) over 32 days post-inoculation (p.i.) and modified our in-vivo agent-based modeling (ABM) to gain insights into the HBV lifecycle and spread in vitro. Parallel PHH cultures were mock-treated or treated with HBV entry inhibitor Myr-preS1 (6.25 µg/mL) was initiated 24 h p.i. In untreated PHH, three viral DNA kinetic patterns were identified: (i) an initial decline, followed by (ii) rapid amplification and (iii) slower amplification/accumulation. In the presence of Myr-preS1, viral DNA and infected cell numbers in phase 3 were effectively blocked, with minimal to no increase. This suggests that phase 2 represents viral amplification in initially infected cells, while phase 3 corresponds to viral spread to naïve cells. The ABM reproduced well the HBV kinetic patterns observed and predicted that the viral eclipse phase lasts between 18 and 38 h. After the eclipse phase, the viral production rate increased over time, starting with a slow production cycle of 1 virion per day, which gradually accelerated to 1 virion per hour after 3 days. Approximately 4 days later, virion production reached a steady state production rate of 4 virions/h. The estimated median efficacy of Myr-preS1 in blocking HBV spread was 91% (range: 90-92%). The HBV kinetics and the predicted estimates of the HBV eclipse phase duration and HBV production cycles in PHH are similar to those predicted in uPA/SCID mice with human livers.IMPORTANCEWhile primary human hepatocytes (PHHs) are the most physiologically relevant culture system for studying HBV infection in vitro, a comprehensive understanding of HBV infection kinetics and spread in PHH is lacking. In this study, we characterize HBV viral kinetics and modify our in vivo agent-based modeling (ABM) to provide quantitative insights into the HBV production cycle and viral spread in PHH. The ABM provides an estimate of the HBV eclipse phase duration, HBV production cycles, and Myr-preS1 efficacy in blocking HBV spread in PHH. The results resemble those predicted in uPA/SCID mice with human livers, demonstrating that estimated HBV infection kinetic parameters in PHH in vitro mirror those observed in the in vivo HBV infection chimeric mouse model.

Keywords: Myr-preS1 treatment; agent-based modeling; hepatitis B virus; primary human hepatocytes; viral hepatitis.


Conflict of interest statement

Yuji Ishida and Chise Tateno are employees of PhoenixBio Co.

Figures

Fig 1
Fig 1
Measured extracellular HBV DNA and percentage of HBV-infected cells in Exps. 1–4 (A–D). A solid line represents the median value of extracellular HBV DNA in the control group (blue) and under Myr-preS1 treatment (red). Error bar denotes the minimal and maximal measurements of extracellular HBV DNA. Boxplot represents the percentage of HBV-infected cells (average ± SD). Arrows indicate the media changes/replenishment.
Fig 2
Fig 2
Measured intracellular HBV DNA in Exps. 1–4 (A–D). Solid line represents the median value of intracellular HBV DNA in the control group (black) and under Myr-preS1 treatment (green). Error bar denotes the minimal and maximal measurements of intracellular HBV DNA.
Fig 3
Fig 3
ABM calibration by fitting to Exp. 4. (A–D). ABM simultaneous calibrations (blue solid curves) with measured extracellular HBV DNA (top) and percentage of HBV-infected PHH (bottom) in Exp. 4. Left panels (A and C): Untreated. Right panels (B and D): Myr-preS1 treated. The ABM calibrations were done using the IMABC algorithm. Black dots are the median empirical calibration target values (i.e., extracellular HBV DNA) for each time point, error bars are the minimal and maximal bounds for the empirical targets, and blue lines represent 1,000 IMABC posterior outputs, all of which are contained within all of the empirical calibration bounds.
Fig 4
Fig 4
ABM prediction of HBV virion production cycles in PHHs. Blue-shaded “E” represents minimal eclipse phase (A) and maximal eclipse phase (B) for PHHs. Each PHH has a randomized eclipse phase followed by a consistent virion production pattern starting with 1 virion/day. As virus resources accumulate, the production cycle shortens. Production also increases to 2, and then three virions before reaching steady state of 4 virions/h. The magnitude of virion production was calculated using equation 1 and the time between each production cycle was calculated using equation 2. The parameter values (α, Pst, γ, δ, and ω) used to calibrate equation 1 and equation 2 were the median level of estimated parameters (Table S4).
Fig 5
Fig 5
Experimental design for PHHs. PHHs were treated with an inoculum of 10 HBV GEq/cell (Exps. 1–3) or 1 HBV GEq/cell (Exp. 4) for 1 day, starting on day 0. Myr-preS1 (6.25 µg/mL) treatment was initiated 1 day after inoculation and then continued throughout the experiment. Extracellular HBV DNA and intracellular HBV DNA were measured in collected culture media at the indicated time points for each experiment. PHHs were harvested for estimating HBV-infected cells. During the infection, culture media were renewed after HBV inoculation or until the end of the experiment as indicated by arrows.
Fig 6
Fig 6
Conceptualization of the agent-based model. (A) The human hepatocytes can be only in one of the following three phases at a given time; T = uninfected cells which are termed as target or susceptible cells, IE = HBV-infected cells in eclipse phase (i.e., not yet releasing virions), IP = HBV-infected cells actively producing/releasing virions. Once IE become Ip, they produce free virus that can further infect T. The free virus in blood, V, is composed of infectious (red center virus) and non-infections virions (blue center virus). The parameter ρ represents the fraction of virions that are infectious, β represents the infection rate constant, Ω represents eclipse phase duration, P(τ) represents virion secretion from IP (Eq. 1), c represents viral clearance from blood, Rr represents the portion of virions removed during medium change/replenishment, and we assume no death/loss for PHHs in the culture media based on Fig. S3. The effectiveness of Myr-preS1 is η when the drug takes effect at teff. (B) Simulated hepatocytes including T (green), IE (yellow), and IP (red) in ABM at 15 days after HBV inoculation. (C) Schematic diagram of a representative hepatocyte progressing through ABM. Each individual hepatocyte has its own infection kinetics followed by a randomized eclipse phase and viral production cycle as shown in Fig. 4.

Update of

References

    1. World Health Organization . 2024. Hepatitis B. Available from: https://www.who.int/news-room/fact-sheets/detail/hepatitis-b
    1. Ye J, Chen J. 2021. Interferon and hepatitis B: current and future perspectives. Front Immunol 12:733364. doi: 10.3389/fimmu.2021.733364 - DOI - PMC - PubMed
    1. Liaw YF, Papatheodoridis G. 2024. Finite nucleos(t)ide-analogue therapy for functional cure in HBeAg-negative chronic hepatitis B: recent development in the paradigm shift. Hepatology. doi: 10.1097/HEP.0000000000001107 - DOI - PubMed
    1. Ploss A, Strick-Marchand H, Li W. 2021. Animal models for hepatitis B: does the supply meet the demand? Gastroenterology 160:1437–1442. doi: 10.1053/j.gastro.2020.11.056 - DOI - PMC - PubMed
    1. Hu J, Lin YY, Chen PJ, Watashi K, Wakita T. 2019. Cell and animal models for studying hepatitis B virus infection and drug development. Gastroenterology 156:338–354. doi: 10.1053/j.gastro.2018.06.093 - DOI - PMC - PubMed

LinkOut - more resources