. 2025 Aug;123(3):e70385.
doi: 10.1111/tpj.70385.

Differential gene reactions reveal drought response strategies in African acacias

Affiliations

Differential gene reactions reveal drought response strategies in African acacias

Ellen I Weinheimer et al. Plant J. 2025 Aug.

Abstract

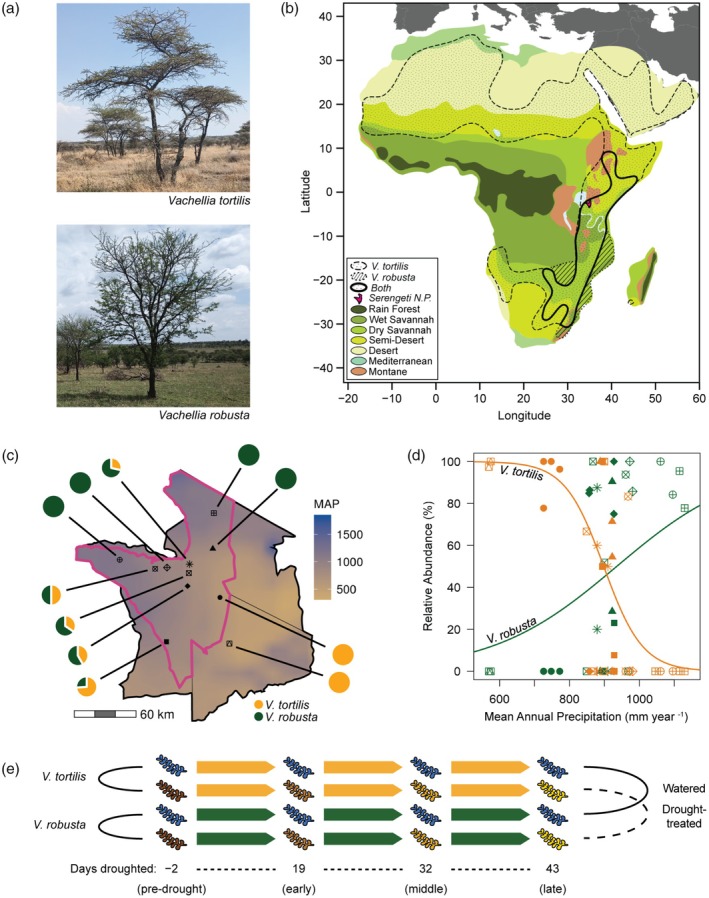
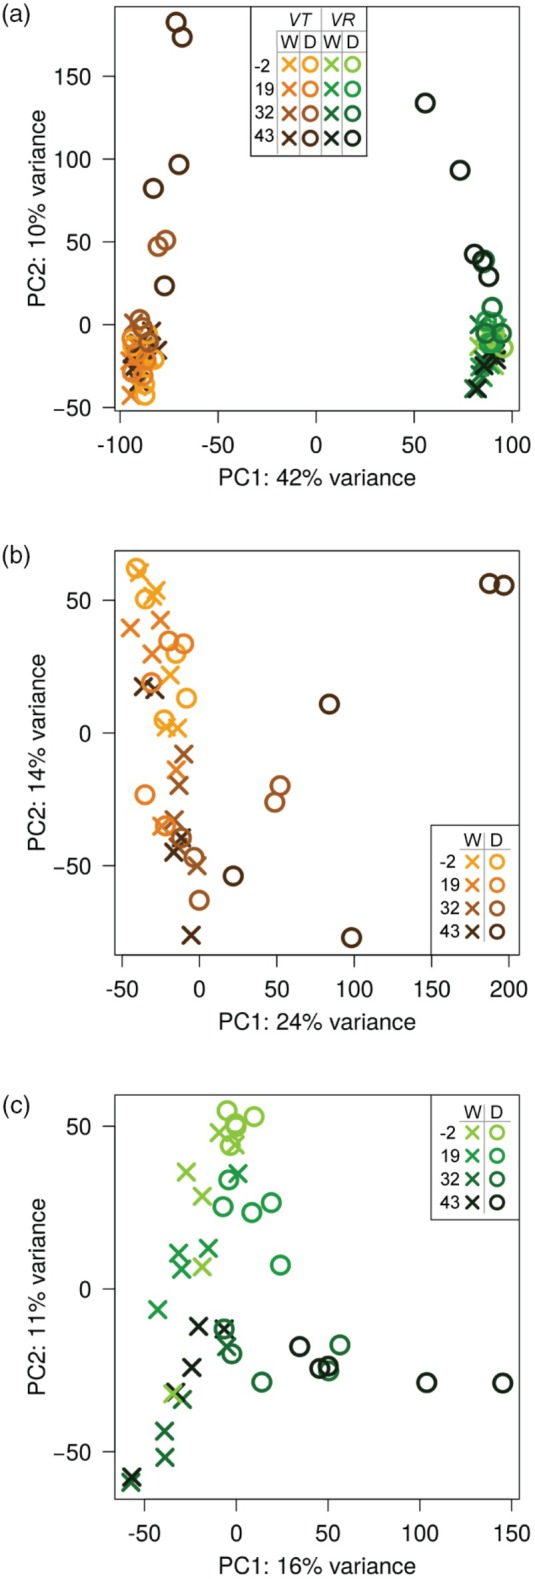
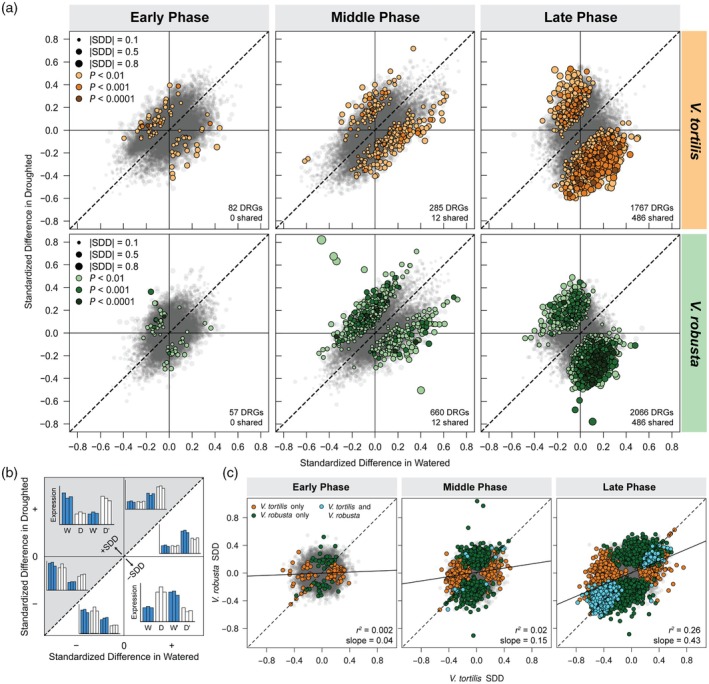
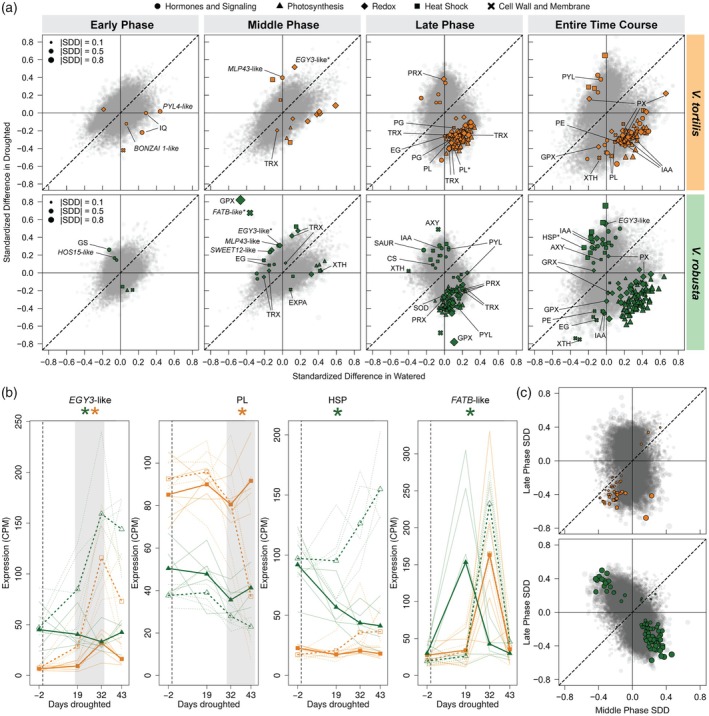
Drought tolerance involves a complex series of genetic reactions that expand over time as water stress intensifies. We investigated gene expression reactions over 43 days of drought stress in two widespread African savanna trees: the umbrella acacia (Vachellia tortilis) and the splendid thorn acacia (Vachellia robusta). Using 80 transcriptomes from droughted and watered individuals over time, we developed and implemented an analytical approach to identify genes with different reactions between a watered control and droughted treatment population of each species while filtering out genes changing similarly in both populations as part of normal growth and development. Our results show that both species use similar genetic systems to modulate photosynthesis, redox homeostasis, and hormone signaling, but they activate these systems using different sets of genes and on different temporal scales relative to the intensity of drought stress. We also find strong evidence that drought tolerant umbrella acacias demonstrate a surprisingly limited and relatively passive transcriptional response to drought stress, while splendid thorn acacias attempt to actively combat drought stress and maintain a steady state of growth and photosynthesis. Our study provides the first transcriptomic analysis of African acacias and a new model for investigating transcriptomic reactions over long periods of stress.

Keywords: Fabaceae; Vachellia robusta; Vachellia tortilis; acacia; differential gene expression; differential gene reaction; drought stress; savanna; transcriptome; water use efficiency.


Conflict of interest statement

The authors declare that they have no competing interests.

Figures

Figure 1
Figure 1
Differences in species distribution and water use underlie genetic divergence between Vachellia tortilis and V. robusta . (a) V. tortilis and V. robusta from Serengeti National Park, Tanzania (Photos by T.M. Anderson). (b) Species range distribution overlaid with biome data across Africa (GBIF, ; GBIF, ; Olsen et al., 2001). (c) Map of Serengeti National Park (outlined in magenta) and surrounding conservation areas overlaid with mean annual precipitation (MAP). The relative abundance of V. tortilis (orange) and V. robusta (green) is shown for 11 long‐term field sites surveyed in 2018 (Holdo et al., ; Morrison et al., 2016). (d) Logistic regression of species relative abundance against mean annual precipitation at 38 subplots within the long‐term field sites, showing a tradeoff between V. tortilis and V. robusta across the rainfall gradient in Serengeti National Park. Individual data points represent the proportion of either V. tortilis or V. robusta relative to all other species at a given subplot. (e) Diagram of drought time course experimental design. Droughted individuals stopped receiving water at Day 0, while watered individuals received water throughout.
Figure 2
Figure 2
Drought‐induced expression reactions are interspecifically distinct but with common features. Principal component analysis of expression profiles from (a) Vachellia tortilis and V. robusta , (b) only V. tortilis , and (c) only V. robusta . Sequence of experimental sampling is represented by darkening colors. Watered and droughted samples are represented by different shapes, as defined in the legend.
Figure 3
Figure 3
Patterns of differential gene reactions differ most strongly between species in the middle phase. (a) Differentially reacting genes in Vachellia tortilis and V. robusta for the three drought phases. Each data point represents a single gene with its standardized difference of watered reaction (x axis), standardized difference of droughted reaction (y axis), total standardized difference‐in‐differences (SDD; point size), and permutation test significance (color shade). Non‐significant genes are plotted in gray. (b) Diagrammatic guide for interpreting two‐factor differentially reacting gene plots in (a) (and Figure 4a). DRGs above the diagonal have SDD >0 and below the diagonal have SDD <0. Barplots provide example scenarios of relative expression change over time between the two treatments. (c) Regression plot of V. tortilis SDD against V. robusta SDD for the three drought phases. Point colors show species‐specific (green and orange) or shared (blue) DRGs.
Figure 4
Figure 4
Differentially reacting genes are functionally relevant and display species‐specific mechanisms through time. (a) Key functional groups of DRGs across the early phase, middle phase, late phase, and the entire time course in Vachellia tortilis and V. robusta . Asterisks indicate DRGs highlighted in 4b. (b) Expression profiles for EGY3‐like (middle‐phase DRG in both species), PL (late‐phase DRG in V. tortilis ), and HSP and FATB‐like (entire time course DRGs in V. robusta ). Mean expression values are shown for V. robusta (green), V. tortilis (orange), watered treatment (solid), and droughted treatment (dashed). Half‐shaded lines track the expression of single individuals. Vertical dotted lines indicate the onset of drought. The phase of interest is shaded in gray for the first two example genes. (c) Middle‐phase SDD values plotted against late phase SDD values for V. tortilis and V. robusta , highlighting the reaction of DRGs detected in both phases. AXY, altered xyloglucan; CS, cellulose synthase; EG, endoglucanase; EXPA, expansin A; GPX, glutathione peroxidase; GRX, glutaredoxin; GS, glutamate synthase; HSP, heat shock protein; IAA, indole‐3‐acetic acid family protein; IQ, IQ domain‐containing protein; PE, pectinesterase; PG, polygalacturonase; PL, pectate lyase; PRX, peroxiredoxin; PYL, pyrabactin resistance 1‐like protein; SAUR, small auxin up‐regulated RNA; SOD, superoxide dismutase; TRX, thioredoxin; XTH, xyloglucan endotransglycosylase/hydrolase.
Figure 5
Figure 5
Differentially reacting genes are not under positive sequence selection. Pairwise d N /d S (x axis) and log10 P (y axis) from the DRG permutation test across the entire time course in Vachellia tortilis (a) and V. robusta (b). Genes with symbol labels are functionally relevant DRGs with evidence of positive selection (i.e., high d N /d S ). Asterisk indicate DRGs highlighted in Figure 4b.

Similar articles

References

    1. Altschul, S.F. , Gish, W. , Miller, W. , Myers, E.W. & Lipman, D.J. (1990) Basic local alignment search tool. Journal of Molecular Biology, 215, 403–410. Available from: 10.1016/S0022-2836(05)80360-2 - DOI - PubMed
    1. Alvarez, M. , Schrey, A.W. & Richards, C.L. (2015) Ten years of transcriptomics in wild populations: what have we learned about their ecology and evolution? Molecular Ecology, 24, 710–725. Available from: 10.1111/mec.13055 - DOI - PubMed
    1. Anderson, T.M. , Morrison, T. , Rugemalila, D. & Holdo, R. (2015) Compositional decoupling of savanna canopy and understory tree communities in Serengeti. Journal of Vegetation Science, 26, 385–394. Available from: 10.1111/jvs.12241 - DOI
    1. Andrew, S.C. , Simonsen, A.K. , Coppin, C.W. , Arnold, P.A. , Briceño, V.F. , McLay, T.G.B. et al. (2024) Expression‐environment associations in transcriptomic heat stress responses for a global plant lineage. Molecular Ecology, 33(16), e17473. Available from: 10.1111/mec.17473 - DOI - PubMed
    1. Bauer, S. , Grossmann, S. , Vingron, M. & Robinson, P.N. (2008) Ontologizer 2.0—a multifunctional tool for GO term enrichment analysis and data exploration. Bioinformatics, 24, 1650–1651. Available from: 10.1093/bioinformatics/btn250 - DOI - PubMed

LinkOut - more resources