. 2025 Aug 4;23(8):e3003332.
doi: 10.1371/journal.pbio.3003332. eCollection 2025 Aug.

Active DNA demethylation upstream of rod-photoreceptor fate determination is required for retinal development

Affiliations

Active DNA demethylation upstream of rod-photoreceptor fate determination is required for retinal development

Ismael Hernández-Núñez et al. PLoS Biol. .

Abstract

Retinal cell fate specification from multipotent retinal progenitors is governed by dynamic changes in chromatin structure and gene expression. Methylation at cytosines in DNA (5mC) is actively regulated for proper control of gene expression and chromatin architecture. Numerous genes display active DNA demethylation across retinal development; a process that requires oxidation of 5mC to 5-hydroxymethylcytosine (5hmC) and is controlled by the ten-eleven translocation (TET) methylcytosine dioxygenase enzymes. Using an allelic series of conditional TET enzyme mutants in mice, we determine that DNA demethylation is required upstream of NRL and NR2E3 expression for the establishment of rod-photoreceptor fate. Using histological, behavioral, transcriptomic, and base-pair resolution DNA methylation analyses, we establish that inhibition of active DNA demethylation results in global changes in gene expression and methylation patterns that prevent photoreceptor precursors from adopting a rod-photoreceptor fate, instead producing a retina in which all photoreceptors specify as cones. Our results establish the TET enzymes and DNA demethylation as critical regulators of retinal development and cell fate specification, elucidating a novel mechanism required for the specification of rod-photoreceptors.


Conflict of interest statement

The authors have declared that no competing interests exist.

Figures
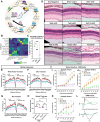
Fig 1
Fig 1. The TET enzymes are required for retinal development and visual function.
(A) Active DNA methylation cycle—(i) 5mC is added by DNMTs. (ii) The TET enzymes oxidize 5mC to 5hmC. (iii) 5hmC is converted to 5fC and 5caC by the TET enzymes, followed by conversion back to cytosine by TDG and the base-excision repair pathway. (iv) Alternatively, APOBEC converts 5mC to thymine, causing DNA mismatch. (B) Expression of DNA demethylation pathway components is enriched in photoreceptors. single-cell RNA-sequencing (scRNAseq) data from [14]. (C) bACE-seq quantification of 5hmC across P21 retinas in Cre−, tHet, and Tet tcKO animal models. Statistics represent results of a One-way ANOVA followed by a Dunnett’s Multiple Comparisons test (** p < 0.01; **** p < 0.0001). (D) H&E staining of an allelic series of TET conditional P21 mutants. (E) Whole retina, (F) outer nuclear layer (ONL) and (G) inner nuclear layer (INL) thickness measures at different eccentricities from the optic nerve head (ONH). Results display the mean + SEM for n = 3 for each genotype in P21 retina. (H) Graph showing the comparison in the mean retinal thickness of control and Tet tcKO retinas between P21 and 6 weeks old retinas. Results display the mean + SEM for n = 3 for each genotype. Statistics are the result of a Two-way ANOVA with, followed by a Tukey’s multiple comparisons test. ns: nonsignificant; ** p < 0.01, *** p < 0.001; **** p < 0.0001. (I–K) Visual function testing as measured by full-field electroretinogram (ERG) indicating scotopic A-wave, scotopic B-wave and photopic B-wave amplitudes across different light intensities. Statistics are the result of a Two-way ANOVA with Geisser–Greenhouse correction, followed by Dunnett’s multiple comparison test to tHet controls. * p < 0.05; ** p < 0.01; *** p < 0.001; **** p < 0.0001. (L) Examples of ERG scotopic dark-adapted intensity (−4 dB) and photopic light-adapted intensity (15 dB) traces comparing tHet and Tet1/2/3 cKO retinas. Abbreviations: Neuro, Neurogenic RPCs; Photo Pre, Photoreceptor Precursor Cells; BER, base-excision repair; DNMTs, de-novo methyltransferases; TDG, thymine DNA glycosylase; Tets, tet-eleven translocation methylcytosine dioxygenases. Scale bars: 100 µm. Data files for graphs available in S1 Data.
Fig 2
Fig 2. Cell fate proportions are altered in TET enzyme conditional mutant retinas.
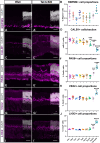
(A, A′) Immunohistochemistry for retinal ganglion cells (RBPMS), (B) Graph showing cell counts of RBPMS+ cell proportions across genotypes. (C, C′) Immunohistochemistry for horizontal cells (CALB1). (D) Graph showing cell counts of CALB1 + cell proportions across genotypes. (E, E′) Immunohistochemistry for amacrine cells (PAX6). (F) Graph showing cell counts of PAX6+ cell proportions across genotypes. (G, G′) Immunohistochemistry for bipolar cells (VSX2). (H) Graph showing cell counts of VSX2+ cell proportions across genotypes. (I, I′) Immunohistochemistry for Müller glia cells (LHX2). (J) Graph showing cell counts of LHX2+ cell proportions across genotypes. Results display the mean + SEM for n = 5 for each genotype. Statistics are the result of Ordinary One-Way ANOVA, followed by a Dunnett’s multiple comparisons test compared to Cre− controls. * p < 0.05; ** p < 0.01; *** p < 0.001; **** p < 0.0001. Scale bars: 100 µm. Data files for graphs available in S4 Data.
Fig 3
Fig 3. Photoreceptor fate proportions are biased towards cone photoreceptors in TET mutant retinas.
(A-H) Immunohistochemistry for S-opsin (OPN1SW) and rhodopsin (RHO) comparing tHet and Tet tcKO retinas at P21 and 6 weeks. (I–L′) Immunohistochemistry for CRX and NRL comparing tHet and Tet tcKO retinas at P21. (M–P′) Immunohistochemistry for RXRγ and RCVRN comparing tHet and Tet tcKO retinas at P21. (Q–X′) Immunohistochemistry for NR2E3 and ARR3 comparing tHet and Tet tcKO retinas at P21 and 6 weeks. (Y) Graphs showing cell counts of CRX+, RXRγ+, ARR3+, and NR2E3+ cell proportions across genotypes. Results display the mean + SEM for n = 5 (n = 3 in the case of CRX) for each genotype. Statistics are the result of Ordinary One-Way ANOVA, followed by a Dunnett’s multiple comparisons test. * p < 0.05; **** p < 0.0001. Scale bars: 100 µm. Data files for graphs available in S8 Data.
Fig 4
Fig 4. Loss of TET enzymes in RPCs alters retinal neurogenesis and extends the birth window of cone-photoreceptors.
(A, H) Summary schemas showing the timeline of P0–P1 and P0–P14 EdU experiments. (B, D, F, I, K, M) Immunohistochemistry showing the labeling of progenitor cells (CHX10+), photoreceptors (CRX+), rod-photoreceptors (NR2E3+), and cone-photoreceptors (RXRγ+) in Cre− and Tet1/2/3 cKO retinas at P1 or P14 after EdU injection at P0. (C, E, G, J, L, N) Graphs showing proportion of cells exiting the cell cycle (CHX10+/EdU+), proportions of photoreceptors (CRX+/EdU+), proportions of rod-photoreceptors (NR2E3+/EdU+) and proportions of rod-photoreceptors (RXRγ+/EdU+). Results display the mean + SEM for n = 6 (P0–P1) or n = 5 (P0–P14) for each genotype. Statistics are the result of a two-tailed Unpaired t test; ns: nonsignificant; * p < 0.05, **** p < 0.0001. Scale bars: 100 µm. Data files for graphs available in S11 Data. Fig 4A and 4H were created using icons from NIH BioArt (https://bioart.niaid.nih.gov).
Fig 5
Fig 5. Tet loss-of-function promotes cone photoreceptors GRNs at the expense of rod photoreceptors.
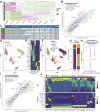
(A) Heatmap of differential transcripts across bulk P21 retinal RNAseq replicates. (B) RNA transcript expression in Cre− and Tet tcKO retinas, colored by differential expression significance and direction of change. (C) Gene Ontology (GO) analysis of differentially expressed transcripts indicating enriched Biological Pathways of Up- and Down-regulated transcripts. (D) UMAP dimension reduction of retinal neurons and glia from snRNAseq on P21 Cre− and Tet tcKO retinas, with cells colored by genotype. (E) Heatmap showing relative expression enrichment of cell type markers within snRNAseq annotated cell types. (F) UMAP dimension reduction of retinal neurons and glia from snRNAseq on P21 Cre− and Tet tcKO retinas colored by annotated cell type. (G) Proportions of annotated cell types by genotype. (H) Boxplots displaying the relative fold change of snRNAseq differentially expressed transcripts in bulk RNAseq experiments. Asterisks represent p-values from Wilcoxon Rank Sum statistical comparisons; * p < 2.2e−16 (I) Pseudo-bulked, average transcript expression of snRNAseq experiments from Tet tcKO and Cre−. Transcripts are colored by differential expression significance and direction of change. (J) Developmental and cell type expression enrichment of differentially expressed transcripts from Tet tcKO RNAseq experiments in the retinal development dataset [14]. Data files for graphs available in S14 Data.
Fig 6
Fig 6. Tet tcKO results in dramatic changes in the retinal methylome.
(A) Comparisons of the temporal WGBS methylation patterns at early (E14) mid (P0) and late (P14) timepoints of retinal development across the ± 5 kb of the TSS for up- and down-regulated transcripts from Tet tcKO RNAseq experiments. (B) Line graph displaying the average CpG methylation levels across retinal development of the proximal TSS for up- and down-regulated transcripts across retinal development. (C) Scatterplot of the average methylation levels from WGBS performed on P21 Cre− and Tet tcKO samples for mCG, mCH, and mCHG. (D) Density plot of DMRs for 5mC between P21 Tet tcKO and Cre− control retinas. (E) Scatterplot of the average 5hmC levels from bACE-seq performed on P21 Cre− and Tet tcKO samples. (F) Density plot of DMRs for 5hmC between P21 Tet tcKO and Cre− control retinas. (G, H) Line plot showing the average (G) 5mC or (H) 5hmC levels across the proximal promoter Tet tcKO and Cre (-) control retinas. (I) Heatmaps displaying temporal methylation patterns and 5mC and 5hmC profiles of the promoter regions in Tet tcKO and Cre− control retinas for selected, differentially expressed transcripts from RNAseq experiments. (J, K) Boxplots of promoter (J) 5mC and (K) 5hmC levels for genes that display differential transcript expression in RNA-seq experiments (P21 Tet tcKO compared to Cre− controls). (L, M) Line plots showing the average (L) 5mC or (M) 5hmC levels across gene bodies in Tet tcKO and Cre− control retinas. (N,O) Boxplots displaying average (N) 5mC or (O) 5hmC across gene bodies of differentially expressed transcripts in RNA-seq experiments (P21 Tet tcKO compared to Cre− controls). (P, Q) Boxplots displaying average 5hmC levels across the (P) gene body or (Q) promoter for all genes, binned in quartiles by transcript expression levels in P21 Cre− RNA-seq. Statistics represent results of a Wilcoxon Rank Sum Test for pairwise comparisons of Quartile 1. (R, S) Boxplots of average methylation profiles for differentially hypomethylated regions identified in comparisons between (R) Rods vs. Cones and (S) rd7 Rods vs. Cones in P21 Cre− and TET tckO retinal samples and sorted cones, rods, and rd7 rods. Statistical analyses and G represent the results of unpaired student t tests (C, G, L–O; ** p < 0.01, ns, not significant). Data files for graphs available in S17 Data.
Fig 7
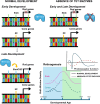
Fig 7. Model of the molecular mechanisms by which TET-mediated DNA demethylation regulates photoreceptor fate decisions.
During early retinal development rod-photoreceptor genes (including NRL and NR2E3) are methylated. As cone-photoreceptor genes are lowly methylated, cone fate is favored. As development progresses, the TET enzymes mediate demethylation of rod-promoting genes. In the absence of TET enzymes, demethylation of NRL, NR2E3, and other genes is inhibited, preventing expression and leading to a retina where all photoreceptors are specified as cones.

Update of

References

    1. Turner DL, Cepko CL. A common progenitor for neurons and glia persists in rat retina late in development. Nature. 1987;328(6126):131–6. doi: 10.1038/328131a0 - DOI - PubMed
    1. Turner DL, Snyder EY, Cepko CL. Lineage-independent determination of cell type in the embryonic mouse retina. Neuron. 1990;4(6):833–45. doi: 10.1016/0896-6273(90)90136-4 - DOI - PubMed
    1. Alexiades MR, Cepko CL. Subsets of retinal progenitors display temporally regulated and distinct biases in the fates of their progeny. Development. 1997;124(6):1119–31. doi: 10.1242/dev.124.6.1119 - DOI - PubMed
    1. Elliott J, Jolicoeur C, Ramamurthy V, Cayouette M. Ikaros confers early temporal competence to mouse retinal progenitor cells. Neuron. 2008;60(1):26–39. doi: 10.1016/j.neuron.2008.08.008 - DOI - PubMed
    1. Li S, Mo Z, Yang X, Price SM, Shen MM, Xiang M. Foxn4 controls the genesis of amacrine and horizontal cells by retinal progenitors. Neuron. 2004;43(6):795–807. doi: 10.1016/j.neuron.2004.08.041 - DOI - PubMed

MeSH terms

LinkOut - more resources