. 2025 Oct:86:103796.
doi: 10.1016/j.redox.2025.103796. Epub 2025 Aug 5.

Ferroptosis triggers anti-tumor immunity via promoting chaperone-mediated autophagic degradation of SHP2

Affiliations

Ferroptosis triggers anti-tumor immunity via promoting chaperone-mediated autophagic degradation of SHP2

Jiazhen Zhu et al. Redox Biol. 2025 Oct.

Abstract

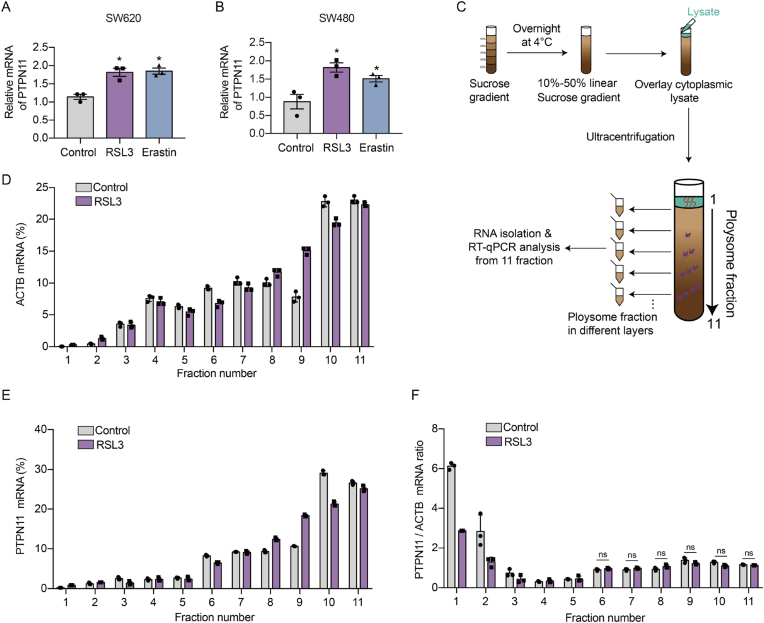
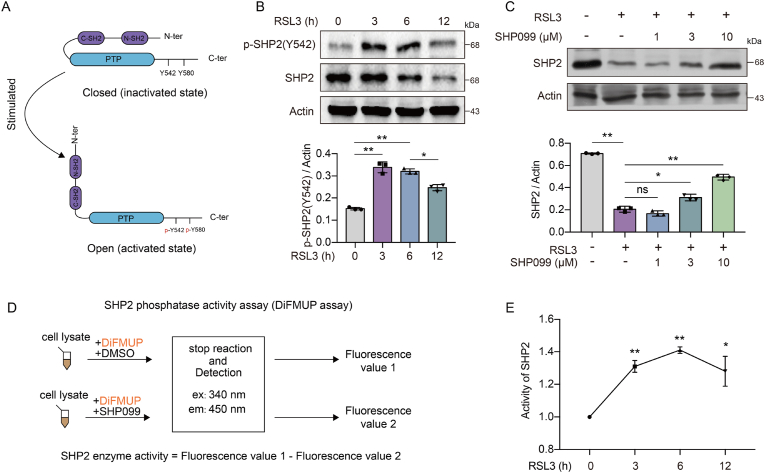
Ferroptosis, a form of regulated cell death characterized by iron-dependent lipid peroxidation, plays a significant role in various physiological and pathological processes, including cancer. However, the connection between ferroptosis and anti-tumor immunity remains incompletely understood. Our investigation demonstrates that ferroptosis inducers like RSL3 can enhance the efficacy of anti-PD-1 therapy by activating the STAT1 signaling pathway. Mechanistically, RSL3 activates the tyrosine phosphatase SHP2 in cancer cells and facilitates its degradation through chaperone-mediated autophagy mediated by the KFERQ motif from residues 530 to 534. This enhances cancer cells' sensitivity to IFN-γ, leading to increased phosphorylation and nuclear translocation of STAT1 and higher expression of major histocompatibility complex class I (MHC I). Consequently, this heightened sensitivity correlates with increased susceptibility to T cell-mediated cytotoxicity. In vivo studies showed that RSL3 treatment reduced SHP2 expression within tumor tissues and bolstered anti-tumor immunotherapy by promoting increased T cell infiltration and function. The combination of RSL3 and anti-PD-1 antibody demonstrates superior therapeutic efficacy in controlling tumor growth compared to monotherapy. Our study not only elucidates a previously unrecognized link between ferroptosis and anti-tumor immunity but also presents a rationale for combining ferroptosis inducers with immune checkpoint inhibitors in cancer treatment.

Keywords: Anti-PD-1; Cancer immunotherapy; Chaperone mediated autophagy; Ferroptosis; SHP2.


Conflict of interest statement

Declaration of competing interest The authors declare that they have no known competing financial interests or personal relationships that could have appeared to influence the work reported in this paper.

Figures

Fig. 1
Fig. 1
Ferroptosis activity was strongly correlated with the interferon-gamma response. (A) Top 25 significant GO Biological Process (BP) terms for cells with high versus low ferroptosis activity from GSEA analysis. (B) Dot plot showing enriched immune-related GO BP terms from GSEA analysis. (C) Volcano plot showing differentially expressed genes of the Interferon Gamma Response gene set. Gray indicates non-significant genes, red indicates upregulated genes in the pathway, and blue indicates downregulated genes in the Hallmark Interferon Gamma Response gene set. Significance was determined by Benjamini-Hochberg adjusted two-sided Wilcoxon test. (D) GSEA analysis of the Hallmark Interferon Gamma Response gene set. (E) GSEA analysis of the KEGG JAK-STAT signaling pathway. (F) GSEA analysis of the Hallmark Interferon Gamma Response gene set. (G) GSEA analysis of the KEGG JAK-STAT signaling pathway. (H) Heatmap of differentially expressed genes, showing expression levels between the ferroptosis model and the sham group, annotated with downstream targets of STAT1.
Fig. 2
Fig. 2
Ferroptosis promoted immune responses and increased cellular responsiveness to IFN-γ. (A) Immune-related BP terms in mass spectrometry results. (B) Schematic diagram of the downstream pathway of cells receiving IFN-γ signaling. (C) mRNA levels of HLA-ABC, PD-L1, and CXCL10 with or without pre-treated RSL3 (10 μM, 12 h) followed by IFN-γ treatment (50 ng/mL, 12 h). (D–F) HLA-ABC, PD-L1 expression with or without pre-treated RSL3 (10 μM, 12 h) followed by IFN-γ treatment (50 ng/mL, 12 h) by immunoblotting or flow cytometry. (G) Expression of STAT1, p-STAT1, JAK2, p-JAK2 with or without pre-treated RSL3 (10 μM, 12 h) followed by IFN-γ treatment (50 ng/mL, 1 h). (H) Nuclear localization of p-STAT1 with or without pre-treated RSL3 (10 μM, 12 h) followed by IFN-γ treatment (50 ng/mL, 1 h), scale bar, 20 μm. Data are presented as mean ± SEM of three independent experiments, and statistical analysis was performed using an unpaired Student's t-test. ∗P < 0.05, ∗∗P < 0.01.
Fig. 3
Fig. 3
The ferroptosis inducer led to a reduction in the protein expression of SHP2. (A) Non-targeted quantitative proteomic analysis of SW480 cells before and after RSL3 (10 μM, 12 h) treatment. (B) Schematic diagram of SHP2 playing a negative regulatory role in the STAT1 signaling pathway. (C–H) Expression of SHP2 in the case of ferroptosis induction was examined by western blotting. Cells were treated as indicated with RSL3 or Erastin. Data are presented as mean ± SEM of three independent experiments, and statistical analysis was performed using an unpaired Student's t-test. ∗P < 0.05, ∗∗P < 0.01 vs. as control.
Fig. 4
Fig. 4
Ferroptosis inducer did not alter transcription or translation of SHP2. (A, B) Expression of SHP2 mRNA under ferroptosis induction, cells were treated as indicated with RSL3 (10 μM) or Erastin (20 μM) for 12 h, and mRNA was measured via qPCR. (C) Schematic diagram of translation efficiency detection experiment. (D, E) Actin and SHP2 mRNA ratios in different sucrose fractions. Different sucrose fractions were collected, and mRNA of Actin (D) and SHP2 (E) in each fraction was measured via qPCR. (F) Relative ratio of SHP2 and Actin mRNA in different sucrose fractions. Data are presented as mean ± SEM of three independent experiments, and statistical analysis was performed using an unpaired Student's t-test. ∗P < 0.05, ∗∗P < 0.01 vs. as control.
Fig. 5
Fig. 5
Ferroptosis inducer triggered CMA degradation of SHP2. (A) Expression of SHP2 using autophagy inhibitors and proteasome inhibitors under RSL3 induction. Cells were treated with RSL3 (5 μM, 24 h), and treated with different autophagy inhibitors NL (20 mM NH4CL combined with 100 μM Leucine), CQ (chloroquine, 50 μM), 3 MA (3-Methyladenine, 10 mM) or proteasome inhibitor MG132 (15 μM) 9 h before being collected. (B) Schematic diagram of chaperone-mediated autophagy. (C, D) Expression of SHP2 was measured under RSL3 treatment (10 μM, 12 h) when overexpression or knockdown of Lamp2A. (E) Co-IP of SHP2 from SW480 cells treated with RSL3 for 12 h, followed by immunoblot analysis. (F) Endogenous SHP2 accumulates rapidly on lysosomes marked by Lamp1 in SW480 cells after being treated with RSL3 (10 μM, 2h), scale bar, 10 μm. Data are presented as mean ± SEM of three independent experiments, and statistical analysis was performed using an unpaired Student's t-test, ∗P < 0.05, ∗∗P < 0.01.
Fig. 6
Fig. 6
KFERQ motif mediated SHP2 CMA. Schematic diagram of SHP2. SHP2 contains three canonical KFERQ motifs, which were found using KFERQ finder V0.8 (https://rshine.einsteinmed.edu). Three KFERQ motifs were mutated as indicated. (B) SW480 cells were transfected with different SHP2 plasmids as indicated, then treated with RSL3 (10 μM) for 12 h followed by immunoblot analysis. (C) Co-IP of SHP2 from SW480 cells treated with RSL3 for 12 h when transfected with different SHP2 plasmids as indicated, followed by immunoblot analysis. (D) Cells were transfected with different SHP2 plasmids as indicated, and treated with RSL3 (10 μM) for 8 h under control or Lamp2A knockdown circumstances followed by immunoblot analysis. Data are presented as mean ± SEM of three independent experiments, and statistical analysis was performed using an unpaired Student's t-test. ∗P < 0.05, ∗∗P < 0.01 vs. as control.
Fig. 7
Fig. 7
SHP2 degradation depends on its unfolded structure. (A) Schematic diagram of the relationship between SHP2 enzyme activity and its structure. (B) Expression of SHP2 and its active form p-SHP2 (Y542) under ferroptosis induction (RSL3, 10 μM). (C) Expression of SHP2 using SHP2 allosteric inhibitors SHP099 under RSL3 (10 μM, 8 h) treatment. (D) Schematic diagram of SHP2 enzyme activity detection. (E) SHP2 enzyme activity when induced by RSL3 (10 μM) as indicated. Data are presented as mean ± SEM of three independent experiments, and statistical analysis was performed using an unpaired Student's t-test, ∗P < 0.05, ∗∗P < 0.01.
Fig. 8
Fig. 8
RSL3 synergizes with PD-1 blockade in CT26 xenograft mice. The Balb/C mice were subcutaneously inoculated with CT26 colon cancer cells, and treated with anti-PD-1 (5 mg/kg i.p. once every three days) and/or RSL3 (5 mg/kg i.p. every day) from day 5 onwards. All results presented are of day 17 post-inoculation. (A) Mean tumor volumes of different groups. (B) Images of tumors. (C) Mean tumor weights of different groups. (D) H&E staining of tumor sections. (E) PCNA immunohistochemistry staining of tumor sections. (F) TUNEL assay for apoptotic cells in tumor sections. (G) Examination of CD4+, CD8+ T cell infiltration in the tumor by IF. (H–I) Examination of CD8+, IFN-γ secretion in the tumor by flow cytometry. (J–L) Expression of SHP2, H2-Kd and p-STAT1 of tumor sections. Scale bar, 50 μm. Data in B, C, H, and I represent the mean ± SEM of 7 mice per group and statistical analysis was performed using an unpaired Student's t-test, ∗P < 0.05, ∗∗P < 0.01.

References

    1. Xia C., Dong X., Li H., Cao M., Sun D., He S., et al. Cancer statistics in China and United States, 2022: profiles, trends, and determinants. Chin. Med. J. (Engl) 2022;135:584–590. - PMC - PubMed
    1. Xi Y., Xu P. Global colorectal cancer burden in 2020 and projections to 2040. Transl. Oncol. 2021;14 - PMC - PubMed
    1. Stockwell B.R., Friedmann Angeli J.P., Bayir H., Bush A.I., Conrad M., Dixon S.J., et al. Ferroptosis: a regulated cell death nexus linking metabolism, redox biology, and disease cell. 2017;171:273–285. - PMC - PubMed
    1. Yang W.S., Stockwell B.R. Ferroptosis: death by lipid peroxidation. Trends Cell Biol. 2016;26:165–176. - PMC - PubMed
    1. Jiang X., Stockwell B.R., Conrad M. Ferroptosis: mechanisms, biology and role in disease. Nat. Rev. Mol. Cell Biol. 2021;22:266–282. - PMC - PubMed

Substances