. 2025 Aug 3;13(8):e010099.
doi: 10.1136/jitc-2024-010099.

HERV-derived epitopes represent new targets for T-cell-based immunotherapies in ovarian cancer

Affiliations

HERV-derived epitopes represent new targets for T-cell-based immunotherapies in ovarian cancer

Paola Bonaventura et al. J Immunother Cancer. .

Abstract

Background: Ovarian cancer represents the most lethal gynecological cancer with poor response to checkpoint inhibitors. Human endogenous retroviruses (HERVs) are aberrantly expressed by tumor cells and may represent a source of shared T-cell epitopes for cancer immunotherapy regardless of the tumor mutational burden.

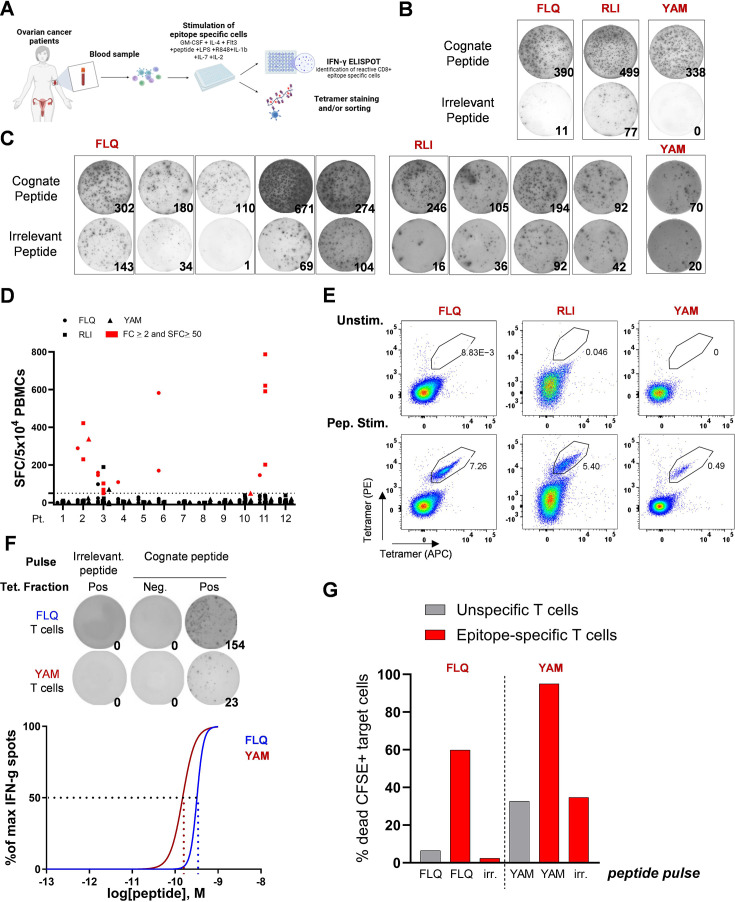
Methods: A transcriptomic analysis based on RNA sequencing was developed to quantify the expression of HERV-K sequences containing the selected epitopes. The presence of HERV-K/HML-2 Gag antigen was then assessed by immunohistochemistry (IHC) on tumor microarrays from ovarian cancer samples and normal ovarian tissues. A specific immunopeptidomics approach was developed to detect epitopes on human leukocyte antigens (HLA) molecules. Epitope-specific CD8+ T cells were quantified by multimer staining. HERV-specific T cells were obtained after in vitro stimulation of T cells from HLA-A2-positive healthy donors or patients with ovarian cancer, and in vitro target cell killing was evaluated using real-time analysis. In vivo antitumor efficacy of HERV-specific T cells was assessed in an avian embryo model.

Results: Epitope-containing HERV transcripts were significantly higher in ovarian cancers compared with normal tissues. The presence of the HERV-K/HML-2 Gag antigen was confirmed by IHC in 20/40 (50%) ovarian cancers while no Gag expression was found in normal ovarian tissue samples. Immunopeptidomics analysis revealed the presence of epitopes on HLA molecules on the surface of ovarian tumor cell lines but not on normal primary cells from critical tissues. Low percentages of HERV-specific T cells were detected among tumor-infiltrating lymphocytes from ovarian cancers. Furthermore, in vitro stimulation of patient T cells induced functional epitope-specific T cells, confirming the immunogenicity of these epitopes in patients with ovarian cancer. In vitro, HERV-specific T cells specifically killed ovarian cancer cells in an HLA class I-restricted manner while sparing normal HLA-A2-positive primary cells derived from critical tissues. Epitope-specific CD8+ T cells exhibited a strong antitumoral activity in vivo, inducing a highly significant decrease in tumor volume in comparison with control groups.

Conclusion: These results provide the preclinical rationale for developing T-cell-based approaches against HERV-K-derived epitopes in ovarian cancer.

Keywords: Immunotherapy; Ovarian Cancer; T cell.


Conflict of interest statement

Competing interests: PB, JV-G, SD are co-inventors on a patent application filed on the subject matter of this study (WO-2020049169-A1). PB, OT, YE, VM, MD, SM, CD, EE, NC, SD are employees of ErVimmune. SD is founder and chairman of ErVimmune.

Figures

Figure 1
Figure 1. Transcriptomic analysis of HERV epitope expression. (A) Schematic representation of data processing. Salmon was used to map and quantify reads to a merged reference transcript annotation containing both genes and HERV annotations. Transcriptomic expression of the epitope was estimated using the sum of all HERV loci with a potential ORF containing its sequence (FLQ, RLI, and YAM). Data were normalized and log transformed (vst) using DESeq2. (B) Volcano plot showing differentially expressed HML-2/HERV-K loci in ovarian cancer against peritumoral tissues from TCGA. Dark-gray dots represent the HML-2/HERV-K loci differentially expressed (log2FC>1 and FDR<0.01, Wald test from DESeq2). Red dots represent the HML-2/HERV-K loci that are differentially expressed and contain FLQ, RLI and/or YAM epitopes in a potential ORF. (C) Differential expression of epitope-containing HERV loci in ovarian cancer against peritumoral tissues from TCGA. Red and blue indicate, respectively, over-expressed or under-expressed HERV loci in ovarian cancer compared with peritumoral tissues; color intensity represents the degree of perturbation (log2FC), and the size of dots the statistical significance (FDR). (D) Epitope-containing HERVs in ovarian cancer (red) and peritumoral tissues from TCGA. Epitope expression levels represent the sum of epitope-containing HERVs normalized and log2 transformed (vst) using DESeq2. The number of HERV loci containing each epitope is represented on top (HERV loci). The number of samples for the corresponding tissues is indicated in the legend (n). Expression levels in ovarian cancer were compared with each tissue for all three peptides. (***log2FC>1 and p value<0.01, **log2FC>0.75 and p value<0.01, *log2FC>0.5 and p value<0.01, Wilcoxon test). FC, fold change; FDR, false discovery rate; HERVs, human endogenous retroviruses; ORF, open reading frame; RNAseq, RNA-sequencing; TCGA, The Cancer Genome Atlas.
Figure 2
Figure 2. HML-2 antigens are selectively expressed in ovarian cancers. (A) Immunohistochemistry of HML-2 Gag antigen on tissue microarrays of ovarian cancer and healthy ovarian samples (20× at microscope and 22× for images, images processed with Halo AI software (Indica Labs, V.3.6.4134)). Representative examples of tumor and normal ovarian tissues and pie chart of HML-2 Gag expression level (low/negative, moderate and high) in the 40 tested cancer samples. (B and C) Targeted immunopeptidomics analysis (Max Rec_Ver2, Complete Omics Inc.) of FLQ and RLI presented on HLA molecules on the surface of the OVCAR3 (B), OVCAR5 (C) ovarian cancer cell lines. Heavy peptides are used as positive control (standard) in left panels. Endogenous targets are shown in right panels. Arrows indicate the peak of the specific epitopes and their molecular weight.
Figure 3
Figure 3. Generation of functional epitope-specific CD8+ T cells from PBMCs of patients with ovarian cancer. (A) Schematic representation of immunogenicity assay used to evaluate HML-2 antigen-specific T cell responses. Patient (Pt.) PBMCs were expanded for 14 days in the presence of HERV epitopes before tetramer staining and IFN-γ ELISpot. (B and C) Representative IFN-γ ELISpot images for Pt. 2 (B) or for selected responsive patients (C). Expanded patient PBMCs were co-cultured with peptide-pulsed T2 cells before IFN-γ ELISpot. (D) Summary of ELISpot data (n=12). The selected wells with FLQ (circle) RLI (square) or YAM (triangle) reactive T cells are depicted in red. FC, fold change; SFC, spot forming cells. (E) Representative FACS plots of tetramer staining of PBMCs non-stimulated (Unstim, upper quadrants) or stimulated with the HERV peptides (Pep. Stim, bottom quadrants) in the same culture conditions. (F) Functional avidity assay. Top: Representative IFN-γ ELISpot of tetramer-positive and tetramer-negative sorted T cells cocultured with T2 cells pulsed with irrelevant or cognate peptide (10−9 M). Bottom: Functional avidity of FLQ-specific and YAM-specific CD8+ T cells, calculated as non-linear fit of normalized IFN-γ production. EC50 are represented by the interpolation of the dashed lines with the X-axis. 10−9 to 10−13 M range was used for the cognate peptide T2 pulsing. Neg, negative; Pos, positive; Tet, tetramer. (G) Quantification of unspecific or FLQ-specific and YAM-specific T cell-induced cell death of CFSE+T2 cells pulsed with cognate or irrelevant peptide (10−6 M). APC, allophycocyanin; CFSE, carboxyfluorescein succinimidyl ester; EC50, half-maximal cytokine response; Flt3, FMS-like tyrosine kinase 3; GM-CSF, granulocyte-macrophage colony-stimulating factor; HERVs, human endogenous retroviruses; IL, interleukin; LPS, lipopolysaccharide; IFN, interferon; PBMC, peripheral blood mononuclear cell; PE, phycoerythrin.
Figure 4
Figure 4. HML-2 epitope-specific CD8+ T cells kill ovarian tumor cells in vitro. (A) Representative plots of tumor cell lysis kinetics of OVCAR3 cells in co-culture with FLQ- (left quadrant, E:T ratio 2:1), RLI- (central quadrant, E:T ratio 5:1) and YAM- (right left quadrant, E:T ratio 5:1) specific CD8+ T cells, or the corresponding tetramer-negative fractions (unspecific) assessed by measuring the cell index with the Xcelligence system. Results are presented as mean±SD of technical triplicates of a representative experiment of n=3 for FLQ and YAM, n=2 for RLI and YAM. (B) Representative 10× images of co-cultures of FLQ-T cells with OVCAR3 presented in A and C at 0 hour and 24 hours. Annexin V+ dead cells are depicted in green. (C) Cell death quantification of annexin V+ OVCAR3 cells (green object/image) at 0, 6, 24 and 48 hours after the addition of FLQ-specific, RLI-specific and YAM-specific CD8+ T cells or unspecific T cells. Results are expressed as mean±SD of two different images. (D and E) Maximal cell lysis of ovarian cancer cell lines (OV90, SKOV3) cocultured with epitope-specific T cells or the corresponding tetramer-negative fraction (unspecific) from healthy donors (D) or ovarian cancer patients (E). E:T ratio 5:1. In C, D and E, co-cultures with epitope-specific T cells are depicted in red and co-cultures with unspecific T cells are depicted in blue. In C, target cells alone are depicted in black, and the addition of the anti-HLA antibody to co-cultures with epitope-specific T cells is depicted with a red dotted line. E:T, effector:target; HLA, human leukocyte antigen.
Figure 5
Figure 5. HERV epitope-specific T cells are not cytotoxic toward healthy primary cells. (A) Viability of normal primary cells (HCM, NHEK, NHEK, HA, NHKpT, HBEpC) alone or co-cultured with unspecific T cells (negative tetramer fraction) or FLQ-specific, RLI-specific and YAM-specific T cells (5:1 effector to target cell ratio) monitored by normalized cell index through xCELLigence. OVCAR3 was used as a positive control. Data not interpretable for NHEK co-cultured with RLI-specific T cells (non-specific decrease of impedance). Results are mean±SD of technical triplicates. HA, human astrocytes; HBEpC, human bronchial epithelial cells; HERVs, human endogenous retroviruses; HCM, human cardiac myocytes; HLA, human leukocyte antigen; NCI, Normalized Cell Index; NHEK, normal human epithelial keratinocytes; NHKpT, normal human kidney proximal tubule cells.
Figure 6
Figure 6. HML-2 epitope-specific T cells elicit in vivo antitumor effects. (A) Schematic representation of the in vivo experiments. Effector to target (E:T) cell ratio used 5:1; E, embryonic day; HH, Hamburger-Hamilton stage. (B) Quantification of OVCAR-3 normalized tumor volumes using 3D light sheet microscopy of fluorescent target cells, after 48 hours co-engraftment with FLQ-specific CD8+ T cells (E:T=5:1). Tumor volumes are normalized against body surface area. Results are presented as mean±SD of 45 embryos (target cell alone n=13; unspecific T cells n=18; FLQ-specific CD8+ T cells n=14) ***p<0.001, one-way ANOVA Dunnett’s test. spec., specific; unspec., unspecific. (C) Representative images and volumes for three representative embryos at 48 hours of 3D views (light-sheet imaging) HH25 chick embryos co-engrafted with CFSE-labeled OVCAR3 alone (upper panels) and unspecific T cells (central panels) or FLQ-specific CD8+ T cells (lower panels). ANOVA, analysis of variance; CFSE, carboxyfluorescein succinimidyl ester; 3D, three-dimensional; V, volume.

References

    1. Torre LA, Trabert B, DeSantis CE, et al. Ovarian cancer statistics, 2018. CA Cancer J Clin. 2018;68:284–96. doi: 10.3322/caac.21456. - DOI - PMC - PubMed
    1. Narod S. Can advanced-stage ovarian cancer be cured? Nat Rev Clin Oncol. 2016;13:255–61. doi: 10.1038/nrclinonc.2015.224. - DOI - PubMed
    1. Matulonis UA, Shapira-Frommer R, Santin AD, et al. Antitumor activity and safety of pembrolizumab in patients with advanced recurrent ovarian cancer: results from the phase II KEYNOTE-100 study. Ann Oncol. 2019;30:1080–7. doi: 10.1093/annonc/mdz135. - DOI - PubMed
    1. Moore KN, Bookman M, Sehouli J, et al. Atezolizumab, Bevacizumab, and Chemotherapy for Newly Diagnosed Stage III or IV Ovarian Cancer: Placebo-Controlled Randomized Phase III Trial (IMagyn050/GOG 3015/ENGOT-OV39) JCO. 2021;39:1842–55. doi: 10.1200/JCO.21.00306. - DOI - PMC - PubMed
    1. Bonaventura P, Shekarian T, Alcazer V, et al. Cold Tumors: A Therapeutic Challenge for Immunotherapy. Front Immunol. 2019;10:168. doi: 10.3389/fimmu.2019.00168. - DOI - PMC - PubMed

Substances