. 2025 Aug 1;135(15):e191119.
doi: 10.1172/JCI191119.

A CD4+ T lymphocyte-specific TCR/GSDMD/IL-2 axis facilitates antitumor immunity

Affiliations

A CD4+ T lymphocyte-specific TCR/GSDMD/IL-2 axis facilitates antitumor immunity

Yihan Yao et al. J Clin Invest. .

Abstract

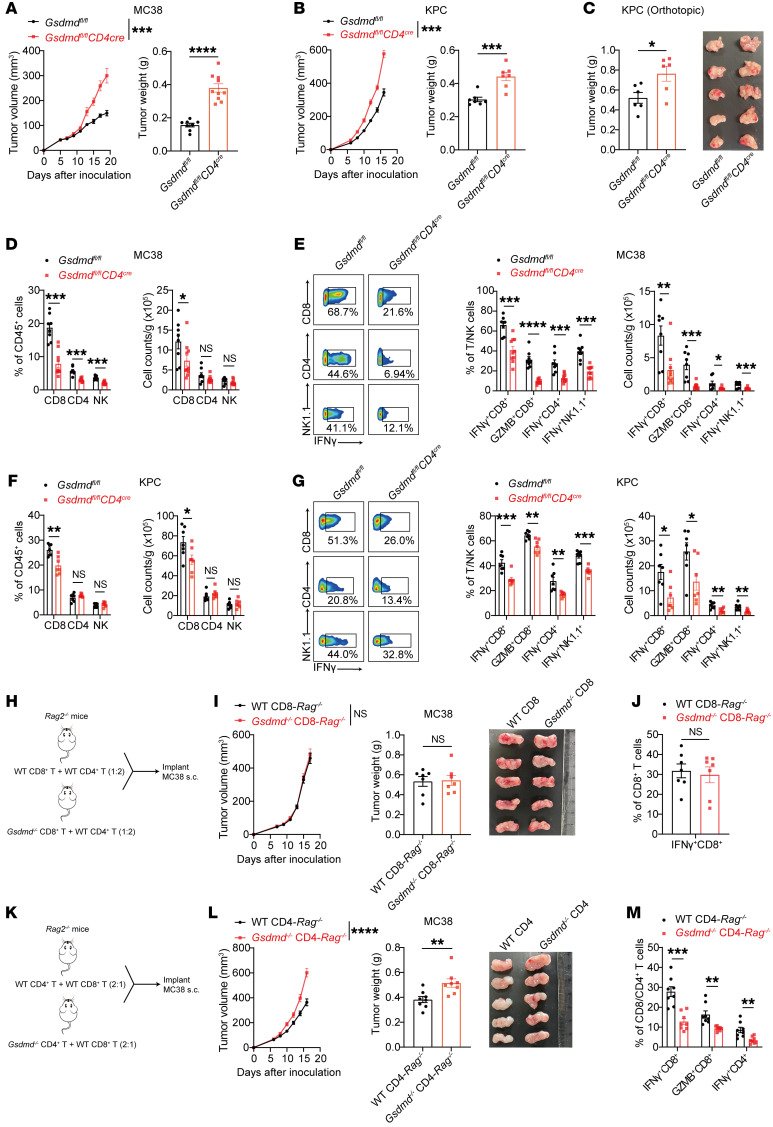
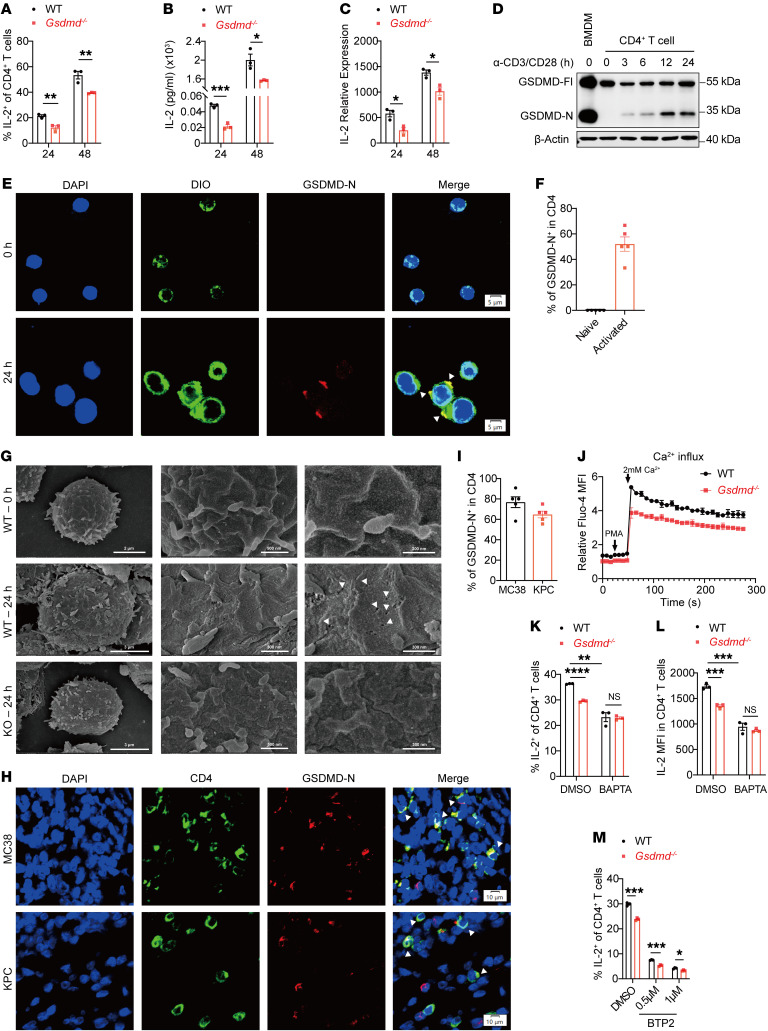
Gasdermin (GSDM) family proteins mediate tumor pyroptosis and impact cancer progression, but other than that, their involvement in the tumor immune microenvironment remains largely unknown. Here, we show that activation of GSDMD in human tumor specimens mainly occurs in tumor-infiltrating leukocytes. Significantly, GSDMD deficiency or its inactivation in CD4+ T cells disabled CD8+ T cell-mediated antitumor immunity and caused tumor outgrowth in mice. Further study uncovered that, via inducing IL-2 production, GSDMD was required for CD4+ T cells to provide help to CD8+ T cell function. Mechanistically, GSDMD was cleaved by TCR stimulation-activated caspase-8 to form GSDMD-N pores, which enhanced Ca2+ influx for IL-2 induction. Moreover, GSDMD activation and function were conserved in human CD4+ T cells and associated with favorable prognosis and improved response to anti-PD-1 immunotherapy in colonic and pancreatic cancer. We believe this study identifies a new nonpyroptotic role of GSDMD in tumor immunity, proposing GSDMD as a potential target for cancer immunotherapy.

Keywords: Calcium signaling; Cancer immunotherapy; Immunology; Oncology; T cells.


Figures

Figure 1
Figure 1. GSDMD deficiency in immune cells promotes tumor growth.
(A and B) Immunofluorescence staining of GSDMD-N (red) and CD45 (green) in tumor tissues from colorectal or pancreatic cancer patients (A). The percentages of GSDMD-N+ cells among CD45+ cells were quantified from 5 independent fields of view within CRC and PAAD tumor tissues (B). Scale bars: 10 μm. The white arrowheads indicate GSDMD-N– and CD45-coexpressing cells. CRC, colorectal cancer; PAAD, pancreatic adenocarcinoma. (C and D) Tumor growth curves (left) and tumor weight (right) of WT and Gsdmd–/– mice subcutaneously inoculated with MC38 (C, n = 10 per group) or KPC tumor cells (D, n = 7 per group). (E and F) Tumor growth curves (left) and tumor weight (right) of Gsdmdfl/fl and Gsdmdfl/fl Vavcre mice subcutaneously inoculated with MC38 (E, n = 6–8 per group) or KPC tumor cells (F, n = 4–5 per group). (G and H) Tumor growth curves (left) and tumor weight (right) of WT mice subcutaneously inoculated with MC38 (G, n = 9 per group) or KPC tumor cells (H, n = 7–8 per group) and treated with DMSO or disulfiram (DSF). (I) Tumor growth curves (left) and tumor weight (right) of WT and Gsdmd–/– mice inoculated with Gsdmd–/– MC38 tumor cells and treated with DMSO or DSF (n = 7–8 per group). Data are presented as mean ± SEM (BI) and are representative of at least 2 independent experiments. *P < 0.05; **P < 0.01; ***P < 0.001; ****P < 0.0001; NS, not significant; as determined by unpaired 2-tailed Student’s t tests for tumor weights in CH and 1-way ANOVA for tumor weights in I or 2-way ANOVA for tumor growth curves.
Figure 2
Figure 2. GSDMD inactivation impairs antitumor immunity in a T cell–dependent manner.
(A and B) Flow cytometry analysis of percentages (left) and cell numbers (right) of tumor-infiltrating lymphocytes (TILs) (A) and expression of IFN-γ and granzyme B by TILs (B) isolated from MC38 tumor–bearing WT (n = 6) and Gsdmd–/– (n = 5) mice on day 18 after tumor inoculation. (C and D) Flow cytometry analysis of lymphocyte infiltration (C) and effector molecule expression (D) in MC38 tumors implanted in WT mice and treated with DMSO (n = 6) or DSF (n = 7). (E) Tumor growth curves (left) and tumor weight (right) of MC38 tumors in WT (n = 5) and Gsdmd–/– (n = 4) mice treated with CD8α-depleting antibodies. (F and G) Flow cytometry analysis of percentages of CD4+ and NK TILs (F) and IFN-γ expression by TILs (G) in MC38 tumors isolated from WT (n = 7) and Gsdmd–/– (n = 8) mice treated with CD8α-depleting antibodies. (H) Tumor growth curves (left) and tumor weights (right) of MC38 tumors in WT mice injected with CD8α-depleting antibodies and treated with DMSO (n = 6) or DSF (n = 8). (IK) Tumor growth curves of MC38 tumors in WT and Gsdmd–/– mice injected with CD4-depleting antibodies (I, n = 8 per group), and flow cytometry analysis of percentages of CD8+ and NK TILs (J) and IFN-γ expression by CD8+ TILs (K). (LN) Tumor growth curves (L) of MC38 tumors in WT mice injected with CD4-depleting antibodies and treated with DMSO (n = 8) or DSF (n = 10), and flow cytometry analysis of percentages of CD8+ and NK TILs (M) and IFN-γ expression by CD8+ TILs (N). Data are presented as mean ± SEM and are representative of at least 2 independent experiments (AN). *P < 0.05; **P < 0.01; ***P < 0.001; ****P < 0.0001; NS, not significant; as determined by 2-way ANOVA for tumor growth curves or unpaired 2-tailed Student’s t tests for TILs.
Figure 3
Figure 3. Deletion of GSDMD in CD4+ T cells leads to impaired CD8+ T cell function.
(A and B) Tumor growth curves (left) and tumor weights (right) of Gsdmdfl/fl and Gsdmdfl/fl CD4cre mice 18 days after subcutaneous inoculation with MC38 (A, n = 8–10 per group) or KPC tumor cells (B, n = 7 per group). (C) Tumor weights (left) and representative tumor images (right) of Gsdmdfl/fl and Gsdmdfl/fl CD4cre mice 18 days after orthotopic injection with KPC cells into the pancreas (n = 6 per group). (DG) Percentages (left) and cell numbers (right) of CD8+, CD4+, and NK TILs (D and F) and expression of IFN-γ and granzyme B by TILs (E and G) in MC38 (D and E) and KPC tumors (F and G) harvested from mice in A and B. (HJ) Experimental design (H) and tumor growth curves (I, left), weights (I, middle), and representative images (I, right) of MC38 tumors implanted in Rag2–/– mice reconstituted with WT or Gsdmd–/– CD8+ T cells plus WT CD4+ T cells (n = 7 per group). Percentages of IFN-γ–expressing CD8+ TILs were analyzed by flow cytometry (J). (KM) Experimental design (K) and tumor growth curves (L, left), weights (L, middle), and representative images (L, right) of MC38 tumors implanted in Rag2–/– mice reconstituted with WT or Gsdmd–/– CD4+ T cells plus WT CD8+ T cells (n = 8 per group). The expression of IFN-γ and granzyme B (GZMB) by CD8+ and CD4+ TILs was analyzed (M). Data are presented as mean ± SEM (AG, I, J, L, and M) and are representative of at least 2 independent experiments (AG). *P < 0.05; **P < 0.01; ***P < 0.001; ****P < 0.0001; NS, not significant; as determined by 2-way ANOVA for tumor growth curves or unpaired 2-tailed Student’s t tests calculated for others.
Figure 4
Figure 4. GSDMD in CD4+ T cells promotes antitumor immunity by increasing IL-2 production.
(A) Levels of the indicated cytokines in supernatant of MC38 tumors isolated from Gsdmdfl/fl and Gsdmdfl/fl CD4cre mice, determined by LEGENDplex (BioLegend) (n = 8 per group). (BE) Quantifications of IL-2 by ELISA in supernatant of MC38 tumors isolated from WT (n = 6) and Gsdmd–/– (n = 9) mice (B), Gsdmdfl/fl (n = 10) and Gsdmdfl/fl CD4cre (n = 8) mice (C), WT mice treated with DMSO or DSF (D, n = 5 per group), or WT (n = 4) and Gsdmd–/– (n = 8) mice treated with CD8α-depleting antibodies (E). (FH) Percentages of IL-2–expressing CD8+ and CD4+ TILs in MC38 tumors implanted in WT (n = 10) and Gsdmd–/– (n = 9) mice (F), WT mice treated with DMSO or DSF (n = 6 per group) (G), or Gsdmdfl/fl (n = 10) and Gsdmdfl/fl CD4cre (n = 8) mice (H), analyzed by flow cytometry. (I and J) Tumor growth curves (left) and tumor weights (right) of WT and Gsdmd–/– mice inoculated with MC38 tumor cells and treated with recombinant IL-2 (I, n = 11 per group). Percentages of IFN-γ–expressing CD8+ TILs were assessed (J). (K and L) Tumor growth curves (left) and tumor weights (right) of MC38 tumors in WT (n = 10) and Gsdmd–/– (n = 12) mice treated with FK506 (K). Percentages of IFN-γ–expressing TILs were assessed (L). (M and N) Tumor growth curves (left) and tumor weights (right) of MC38 tumors in WT mice cotreated with DMSO or DSF and FK506 (M, n = 10 per group). Percentages of IFN-γ–expressing TILs were assessed (N). Data are presented as mean ± SEM and are representative of at least 2 independent experiments (AN). *P < 0.05; **P < 0.01; ***P < 0.001; NS, not significant; as determined by 2-way ANOVA for tumor growth curves or unpaired 2-tailed Student’s t tests for others.
Figure 5
Figure 5. GSDMD-N pores mediate Ca2+ influx for induction of IL-2 in CD4+ T cells.
(AC) Flow cytometry (A), ELISA quantification (B) and RT-qPCR analysis (C) of IL-2 expression by WT and Gsdmd-/- CD4+ T cells activated in vitro. (D) Immunoblot analysis of GSDMD activation in activated CD4+ T cells. LPS- and nigericin-treated bone marrow-derived macrophages (BMDMs) were used as the positive control of GSDMD activation. (E and F) Immunofluorescence staining for GSDMD-N and DiO (a cell membrane fluorescent probe) in activated human CD4+ T cells (E). The percentage of GSDMD-N+ cells among DiO+ cells were quantified from five fields of view (F). Scale bars: 5 µm. (G) Scanning electron microscope (SEM) analysis of membrane pores in naive WT CD4+ T cells and TCR-activated WT or Gsdmd–/– CD4+ T cells. The white arrowheads indicate the membrane pore formation in CD4+ T cells. Scale bars: 2 µm (WT, 0 h; left); 3 µm (WT and KO, 24 h; left); 300 nm (WT, 0 h and 24 h, and KO 24 h; right); 500 nm (WT, 0 h and 24 h, and KO 24 h; middle). (H and I) Immunofluorescence staining for GSDMD-N and CD4 in MC38 (top) and KPC (bottom) tumor tissues (H). The percentages of GSDMD-N+ cells among CD4+ cells (I). Scale bars: 10 µm. The white arrowheads indicate GSDMD-N and CD4 co-expressing cells. (J) Time-course analysis of Ca2+ influx in activated WT and Gsdmd–/– CD4+ T cells in response to PMA stimulation. (KM) Percentages of IL-2-expressing CD4+ T cells (K) and IL-2 MFI in WT and Gsdmd-/- CD4+ T cells (L and M) activated in vitro in the presence or absence of BAPTA (50 µM) (L) or BTP2 (M). Data are presented as mean ± SEM (AC, IM, n = 3 per group) and are representative of at least two independent experiments (AM). *P < 0.05; **P < 0.01; ***P < 0.001; ****P < 0.0001; NS, not significant; as determined by unpaired 2-tailed Student’s t tests.
Figure 6
Figure 6. Caspase-8 mediates GSDMD cleavage in CD4+ T cells after TCR activation, and GSDMD is suppressed by tumor cell–derived proteins.
(A) Immunoblot analysis of caspase cleavage in CD4+ T cells activated in vitro by anti-CD3/CD28 for the indicated times. (B) Immunoblot analysis of GSDMD activation in CD4+ T cells activated in vitro by anti-CD3/CD28 for 24 hours with or without the addition of a caspase-8 inhibitor (Z-IETD-FMK, 100 μM). (C) Immunoblot analysis of GSDMD activation in CD4+ T cells isolated from Caspase-8+/+ Ripk3–/– and Caspase-8–/– Ripk3–/– mice and activated in vitro by anti-CD3/CD28 for 24 hours. (D and E) Percentages of IL-2–expressing CD4+ T cells (D) and IL-2 MFI in CD4+ T cells (E) isolated from WT and Gsdmd–/– mice and activated in vitro in the presence or absence of Z-IETD-FMK for 24 hours. (FH) WT and Gsdmd-/- CD4+ were treated with or without caspase-1 inhibitor (VX-765, 20 µM), caspase-3 inhibitor (zDEVD-FMK, 20 µM) or pan-caspase inhibitor (zVAD-FMK, 20 µM) during in vitro activation by anti-CD3/CD28 for 24 hours. Percentages of IL-2-expressing CD4+ T cells (F) and IL-2 MFI in CD4+ T cells (G) were analyzed. Secreted IL-2 was quantified by ELISA (H). (I and J) Time course analysis of Ca2+ influx in WT and Gsdmd–/– CD4+ T cells activated in vitro with or without the addition of Z-IETD-FMK (I) or zVAD-FMK (J). (K) Immunoblot analysis of GSDMD and caspase-8 protein activation in CD4+ T cells activated in vitro by anti-CD3/CD28 for 24 hours with or without MC38 tumor supernatant at different dilutions. Data are presented as mean ± SEM (DJ, n = 3) and are representative of at least 2 independent experiments. **P < 0.01, ***P < 0.001, NS, not significant, as determined by unpaired 2-tailed Student’s t tests.
Figure 7
Figure 7. GSDMD activation in CD4+ T cells correlates with survival benefit and immunotherapy efficacy in colorectal cancer and pancreatic adenocarcinoma.
(A) Immunoblot analysis of GSDMD protein activation probed with a mixture of full-length and N-fragment–specific GSDMD antibodies in human CD4+ T cells isolated from PBMCs and activated by anti-hCD3/hCD28 for the indicated times. Red asterisks indicate cleaved GSDMD fragments. (B and C) Flow cytometry analysis of percentages of IL-2–expressing human CD4+ T cells (B) and IL-2 MFI in human CD4+ T cells (C) activated in vitro for 24 hours in the presence or absence of DSF (n = 3 per group). (D and E) Percentages of IL-2–expressing cells within shGSDMD-GFP–transduced (GFP+) or nontransduced (GFP) human CD4+ T cells (D) and IL-2 MFI of GFP and GFP+ human CD4+ T cells (E). (FH) Immunofluorescence staining for GSDMD-N (red) and CD4 (green) in tumor tissues from patients with colorectal cancer (F) or pancreatic cancer (G). Percentages of GSDMD-N+ cells among CD4+ cells were quantified from 5 independent fields of view within colorectal cancer (CRC) and pancreatic adenocarcinoma (PAAD) (H). Scale bars: 10 μm. White arrowheads indicate GSDMD-N– and CD4-coexpressing cells. (I and J) Patients with colorectal cancer (I) or pancreatic cancer (J) were stratified into high-activation and low-activation groups based on the median ratio of GSDMD-active CD4+ TILs to total CD4+ TILs, and Kaplan-Meier curves of overall survival were calculated. (K) Tumor growth curves (left) and tumor weights (right) of MC38 tumors implanted in Gsdmdfl/fl and Gsdmdfl/fl CD4cre mice treated with anti–PD-1. (L) Left: Percentages of GSDMD-N+ cells in tumor-infiltrating CD4+ T cells in immunotherapy-responsive and –nonresponsive colorectal cancer patients. Right: Representative images of GSDMD activation in tumor-infiltrating CD4+ T cells. Data are presented as mean ± SEM (BE and HL) and are representative of at least 2 independent experiments (BH and K). *P < 0.05, **P < 0.01, ***P < 0.001, ****P < 0.0001, as determined by unpaired 2-tailed Student’s t tests (B, C, and L), paired 2-tailed Student’s t test (D and E), 1-way ANOVA for tumor weight (K), or log-rank test (I and J).

References

    1. Joyce JA, Fearon DT. T cell exclusion, immune privilege, and the tumor microenvironment. Science. 2015;348(6230):74–80. doi: 10.1126/science.aaa6204. - DOI - PubMed
    1. Bedoui S, et al. CD4(+) T-cell help amplifies innate signals for primary CD8(+) T-cell immunity. Immunol Rev. 2016;272(1):52–64. doi: 10.1111/imr.12426. - DOI - PubMed
    1. Bevan MJ. Helping the CD8(+) T-cell response. Nat Rev Immunol. 2004;4(8):595–602. doi: 10.1038/nri1413. - DOI - PubMed
    1. Wilson EB, Livingstone AM. Cutting edge: CD4+ T cell-derived IL-2 is essential for help-dependent primary CD8+ T cell responses. J Immunol. 2008;181(11):7445–7448. doi: 10.4049/jimmunol.181.11.7445. - DOI - PubMed
    1. Schulz O, et al. CD40 triggering of heterodimeric IL-12 p70 production by dendritic cells in vivo requires a microbial priming signal. Immunity. 2000;13(4):453–462. doi: 10.1016/S1074-7613(00)00045-5. - DOI - PubMed

MeSH terms