. 2025 Aug 1;135(15):e181207.
doi: 10.1172/JCI181207.

ST8Sia6 overexpression protects pancreatic β cells from spontaneous autoimmune diabetes in nonobese diabetic mice

Affiliations

ST8Sia6 overexpression protects pancreatic β cells from spontaneous autoimmune diabetes in nonobese diabetic mice

Justin Choe et al. J Clin Invest. .

Abstract

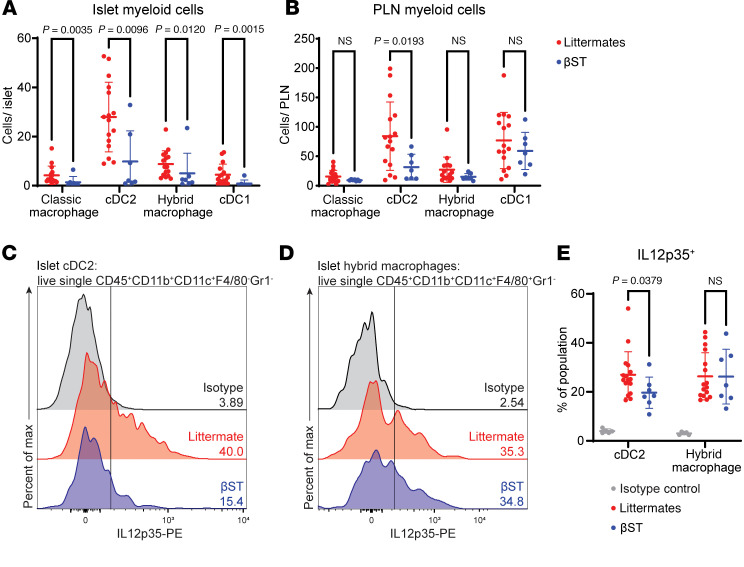
Type 1 diabetes is characterized by the autoimmune destruction of pancreatic β cells, resulting in permanent loss of glucose homeostasis. Islet transplantation is a promising potential cure that remains hindered by immune rejection. We previously showed that ST8Sia6 expression on tumors reduced immune surveillance and hypothesized that this sialyltransferase could protect β cells from autoimmune destruction. Here, we demonstrate that ectopic expression of ST8Sia6 in β cells of female nonobese diabetic mice (NOD βST) decreased the spontaneous incidence of diabetes by 90% and preserved β cell mass. NOD βST mice had comparable insulitis at 8 weeks of age that did not progress over time compared with littermate controls. β Cell-autoreactive B and T cells were present in NOD βST mice, indicating a peripheral rather than central mechanism of immune tolerance. The islets of NOD βST mice displayed a dampened type 1 immune response and reduced IL-12p35 expression in dendritic cells compared with those of littermate controls. The peripheral protection persisted even after removal of ST8Sia6 expression at 20 weeks of age, indicating that transient expression was sufficient for establishment of tolerance. These results demonstrate that ST8Sia6 protects β cells from immune-mediated attack and rejection, highlighting its therapeutic potential for autoimmune disorders.

Keywords: Autoimmune diseases; Autoimmunity; Beta cells; Diabetes; Immunology.


Conflict of interest statement

Conflict of interest: The authors have declared that no conflict of interest exists.

Figures

Figure 1
Figure 1. Expression of ST8Sia6 in the islets of NOD female mice protects from spontaneous disease.
(A) Schematic representation of the genetic model. (B) Representative IHC imaging for the myc-tagged ST8Sia6 in pancreas sections from each genetic combination of alleles in female mice. Only βST mice expressing all 3 alleles stain positive for myc-tagged ST8Sia6 in the islets. Scale bars: 100 μm (black) or 50 μm (white). (C) Kaplan-Meier curve for diabetes-free incidence in female NOD βST and NOD littermate mice. n = 50 (NOD βST) or 151 (littermates). Statistical significance was determined by log-rank Mantel-Cox test. (D) Subanalysis by allelic expression of the littermate population from C for diabetes-free incidence. n = 50 (NOD βST), 62 (LNL-tTA), 76 (RIP-Cre), 67 (ST8Sia6), or 15 (no alleles); the sum of littermate subgroups exceeds 151 because some littermates carried 2 alleles and were thus counted in more than one group. Statistical significance was determined by log-rank Mantel-Cox test comparing each littermate group against NOD βST. (E) Assessment of the extent of immune infiltration into the islets of nondiabetic female NOD βST and littermate mice at 8 weeks, 20 weeks, and 300 days of age. Insulitis was scored along a 4-point scale (0, no insulitis; 1, 0%–25% infiltration; 2, 26%–50% infiltration; 3, 51%–75% infiltration; 4, 76%–100% infiltration) from H&E-stained sections. Analysis was performed on 45 islets from 4 βST and 72 islets from 7 littermate mice at 8 weeks; 50 islets from 6 βST and 59 islets from 12 littermate mice at 20 weeks; and 119 islets from 16 βST and 76 islets from 17 littermate mice at 300 days. Distribution of scores is plotted, and statistical analysis was performed using a χ2 test on islet scores for indicated comparisons.
Figure 2
Figure 2. Disease modulation is secondary to preservation of β cells in the islets.
(A) Representative immunofluorescence images of whole pancreas sections from 8-week-old nondiabetic NOD βST and NOD littermate mice. (B and C) Quantification of insulin+ (green; FITC) area (B) and glucagon+ (red; Cy3) area (C) in the pancreata of 8-week-old nondiabetic NOD βST and littermate mice (n = 4 per group). Error bars represent standard deviation (SD) from the mean. Mann-Whitney U test was used for comparisons. (D) Representative immunofluorescence images of whole pancreas sections from 300-day-old nondiabetic NOD βST, nondiabetic NOD littermate, and diabetic NOD littermate mice. (E and F) Quantification of insulin+ (E) and glucagon+ (F) area in the pancreata of 300-day-old mice (n = 4 per group). One-way ANOVA was performed for statistical analysis between all 3 groups, with Mann-Whitney U test for inset comparison. Scale bars: 1,000 μm, except rightmost panel of D: 2,000 μm. (G) Immunofluorescence images of histologic sections of pancreas from euglycemic NOD βST and NOD littermate mice at the indicated ages with insulin in green (FITC), glucagon in red (Cy3), and DAPI staining for nuclei. Four pancreata from each group at each indicated age were stained and imaged, and representative islets are presented. One islet from a NOD littermate at 300 days of age demonstrates loss of insulin but preservation of glucagon. Scale bars: 20 μm.
Figure 3
Figure 3. Protection from autoimmunity in βST mice is localized to the islet and peripheral in nature.
(A) Representative H&E staining of salivary glands from female 300-day-old nondiabetic NOD βST mice or nondiabetic or diabetic littermate controls. Images are stitched composites (original magnification, ×5). (B) Number of foci of immune infiltrates and percentage area of immune foci in salivary glands of 7 nondiabetic NOD littermate, 5 diabetic NOD littermate, or 8 euglycemic NOD βST mice. Error bars represent SD, and 1-way ANOVA was used for comparisons. (C) ELISA quantification of serum anti-insulin antibodies from nondiabetic female NOD βST and littermate mice. Mice were stratified by age into the first half of the disease kinetics study (6 NOD βST and 14 littermates) or the latter half (15 NOD βST or 23 littermates). Serum from B6 mice (n = 4) was analyzed to determine threshold of detection. Error bars represent SD, and Mann-Whitney U test was used for indicated comparisons. (D) Diabetes-free incidence in 16-week-old female euglycemic mice challenged intraperitoneally with anti–PD-L1 (8 NOD βST and 16 littermates) or anti–PD-1 (8 NOD βST and 11 littermates). Log-rank Mantel-Cox test was performed to analyze statistical differences between indicated groups. (E) Representative immunofluorescence images of CD8 in pancreas from NOD βST and littermate mice after challenge with anti–PD-1 from D. Original magnification, ×2 (islets ). (F) Quantification of CD8+ T cell infiltration in islets from pancreas sections from D. n = 15 islets from 3 NOD littermate pancreas sections (14 islets from 1 mouse challenged with anti–PD-L1, 1 islet from 1 mouse challenged with anti–PD-1) or 16 islets from 4 NOD βST pancreas sections (6 islets from 2 mice challenged with anti–PD-L1, 9 islets from 2 mice challenged with anti–PD-1). Error bars represent SD. Mann-Whitney U test was used for indicated comparison. (G) Insulitis distribution in pancreas sections from F scored and analyzed as in Figure 1E.
Figure 4
Figure 4. βST mice have a reduction in the type 1 immune response in the islet.
(AC) Representative flow cytometry plots of immune cells (A), short-lived effector CD8+ T cells (SLECs) (B), and CD4+ T cell subsets (C) in islets from euglycemic NOD βST or littermate mice at 14 weeks of age. Cells were previously gated by size and singlets. Within the live singlet CD45+TCRβ+CD4+ cell population, Th1 cells (FoxP3T-bet+), Th17 cells (FoxP3RORγt+), and Tregs (parsed by T-bet+ and T-bet) were analyzed. SLECs were defined as T-bet+ cells within the live singlet CD45+TCRβ+CD8+ cell population. (D) Quantification of normalized event count of cells depicted in A. The number of each cell type was normalized to the number of cells per islet per mouse from 5 NOD βST or 14 littermates. (E) Quantification of frequency and normalized cell count of SLECs per islet isolated per mouse. One NOD βST mouse was censored because of lack of insulitis. (F) Quantification of frequency and normalized cell count of CD4+ T cell subsets per islet from C isolated per mouse; one NOD βST mouse was censored because of lack of insulitis. (G) Ratio of T-bet+ Tregs (T-bet+FoxP3+CD4+) to Th1 T cells (T-bet+FoxP3CD4+) from the islets of euglycemic NOD βST or NOD littermate mice at 14 weeks as above and 20 weeks of age (7 NOD βST or 14 littermate mice). (H) Ratio of T-bet+ Tregs (T-bet+FoxP3+CD4+) to SLECs (T-bet+CD8+) from the islets of NOD βST or NOD littermate mice as in G. (I and J) Quantification of PD-1 and PD-L1 expression in CD4+ T cell subsets (I) and SLECs (J) from 4 NOD βST or 5 littermates. Error bars represent SD. Mann-Whitney U tests were used to examine statistical differences between groups.
Figure 5
Figure 5. βST mice have reduced IL-12p35 expression in islet myeloid cells.
(A and B) Normalized cell count of classical macrophages (CD11b+CD11cF4/80+Gr1), hybrid macrophages (CD11b+CD11c+F4/80+Gr1), cDC1s (CD11bCD11c+F4/80Gr1), and cDC2s (CD11b+CD11c+F4/80Gr1) per islet (A) or per pancreatic lymph node (B) from euglycemic 14-week-old NOD βST or littermate mice. (C) Representative flow cytometry histogram of IL-12p35 expression in cDC2s from islets of euglycemic 14-week-old NOD βST and NOD littermate mice, compared with isotype control. (D) Representative flow cytometry histogram of IL-12p35 expression in hybrid macrophages from islets of euglycemic NOD βST and littermate mice, compared with isotype control. Vertical line denotes the positive gate. (E) Quantification of IL-12p35 expression shown in C and D across 7 NOD βST mice, 16 NOD littermate mice, and 5 isotype controls. Error bars represent SD. Mann-Whitney U tests were used to examine statistical differences between groups.
Figure 6
Figure 6. NOD βST mice challenged with recombinant IL-12 demonstrate increased islet inflammation.
(A) Schematic of IL-12 challenge. Euglycemic 14-week-old female NOD βST and littermate mice were injected intraperitoneally with 20 μg/kg of IL-12 daily for 10 days (or until hyperglycemic). (B) Diabetes-free incidence in these mice over 3 weeks. n = 4 (NOD βST) or 12 (NOD littermates). (C) Quantification of normalized counts of all immune cells, CD4+ T cells, and CD8+ T cells in the islets of mice challenged with IL-12 at the study endpoint of 3 weeks. (D and E) Quantification of frequency of CD4+ T cell subsets (D) and CD8+ SLECs (E) in the islets of these mice. (F) Ratio of T-bet+ Tregs (T-bet+FoxP3+CD4+) to Th1 T cells (T-bet+FoxP3CD4+) from the islets of these mice challenged with IL-12, compared with the same ratios from euglycemic 14-week-old mice (control from Figure 4G). (G) Ratio of T-bet+ Tregs (T-bet+FoxP3+CD4+) to SLECs (T-bet+CD8+) from the islets of these mice challenged with IL-12, compared with the same ratios from euglycemic 14-week-old mice (control from Figure 4H). Same gating scheme as Figure 4. Error bars represent SD. Mann-Whitney U test was used to examine statistical differences between groups.
Figure 7
Figure 7. Tolerance from disease is established after 20 weeks.
(A) Confirmation of ST8Sia6-myc shutoff after 5 weeks of doxycycline treatment by IHC. Schematic of doxycycline treatment for temporal control of ST8Sia6 expression. Scale bars: 100 μm. (B) Diabetes-free incidence after treatment of 15 euglycemic NOD βST and 29 euglycemic littermate mice with doxycycline starting at 8 weeks of age. (C) Comparison with disease kinetics of 8-week-old euglycemic non-doxycycline-treated NOD βST (n = 50) or littermate (n = 151) mice (subset from Figure 1C). (D) Diabetes-free incidence after treatment of 12 euglycemic NOD βST and 16 euglycemic littermate mice with doxycycline starting at 20 weeks of age. (E) Comparison with disease kinetics of 20-week-old euglycemic non-doxycycline-treated NOD βST (n = 50) or littermate (n = 115) mice (subset from Figure 1C). Log-rank Mantel-Cox test was used to analyze statistical differences in diabetes-free incidence of indicated groups. (F) Insulitis distribution in pancreas sections of NOD βST mice treated with doxycycline for 5 weeks from 8 weeks or 20 weeks of age, compared with 300-day-old pancreata from NOD βST mice never treated with doxycycline (subset from Figure 1E). Scoring and analysis as in Figure 1E. n = 69 islets from 12 mice (8-week doxycycline) or 127 islets from 11 mice (20-week doxycycline). (G and H) Ratio of T-bet+ Tregs (T-bet+FoxP3+CD4+) to Th1 T cells (T-bet+FoxP3CD4+) (G) or to SLECs (T-bet+CD8+) (H) from islets of 20-week-old mice treated with doxycycline for greater than 5 weeks. (I) Quantification of IL-12p35 expression in hybrid macrophages (CD11b+CD11c+F4/80+Gr1) and cDC2s (CD11b+CD11c+F4/80Gr1) from islets of 20-week-old mice treated with doxycycline for greater than 5 weeks. Same gating schemes as in Figures 4 and 5. Error bars represent SD. Mann-Whitney U test was used for statistical analysis between groups.

References

    1. DiMeglio LA, et al. Type 1 diabetes. Lancet. 2018;391(10138):2449–2462. doi: 10.1016/S0140-6736(18)31320-5. - DOI - PMC - PubMed
    1. Diabetes Control and Complications Trial Research Group, et al. The effect of intensive treatment of diabetes on the development and progression of long-term complications in insulin-dependent diabetes mellitus. N Engl J Med. 1993;329(14):977–986. doi: 10.1056/NEJM199309303291401. - DOI - PubMed
    1. Norris JM, et al. Type 1 diabetes-early life origins and changing epidemiology. Lancet Diabetes Endocrinol. 2020;8(3):226–238. doi: 10.1016/S2213-8587(19)30412-7. - DOI - PMC - PubMed
    1. Hirsch IB, et al. The evolution of insulin and how it informs therapy and treatment choices. Endocr Rev. 2020;41(5):733–755. doi: 10.1210/endrev/bnaa015. - DOI - PMC - PubMed
    1. Breton MD, et al. A randomized trial of closed-loop control in children with type 1 diabetes. N Engl J Med. 2020;383(9):836–845. doi: 10.1056/NEJMoa2004736. - DOI - PMC - PubMed

MeSH terms

Substances