. 2025 Aug 4;16(1):7150.
doi: 10.1038/s41467-025-61880-1.

Temporo-spatial cellular atlas of the regenerating alveolar niche in idiopathic pulmonary fibrosis

Affiliations

Temporo-spatial cellular atlas of the regenerating alveolar niche in idiopathic pulmonary fibrosis

Praveen Weeratunga et al. Nat Commun. .

Abstract

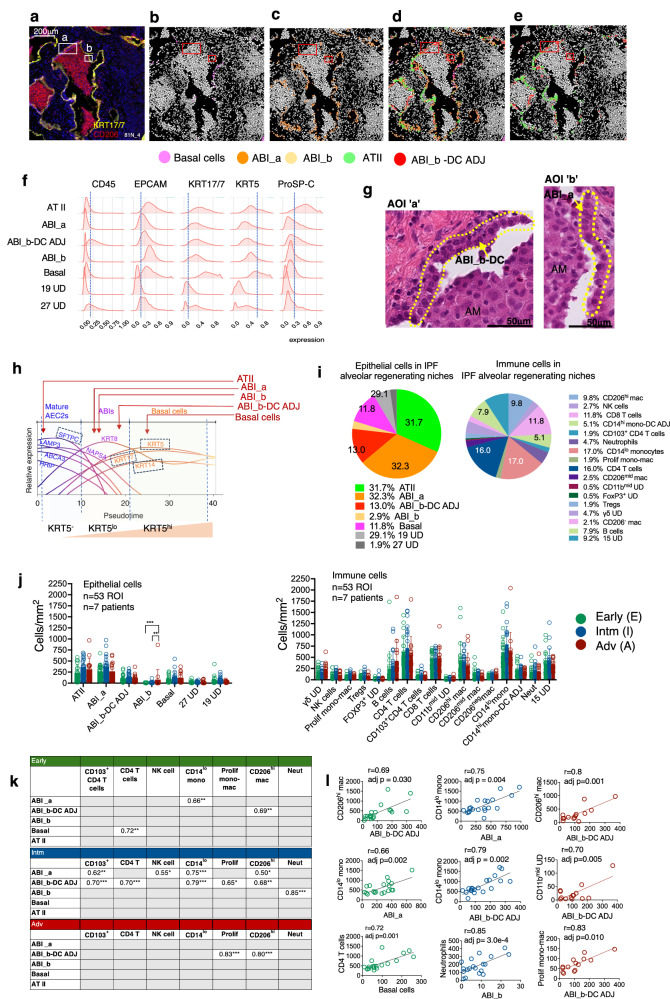
Healthy alveolar repair relies on the ability of alveolar stem cells to differentiate into specialized epithelial cells for gas exchange. In chronic fibrotic lung diseases such as idiopathic pulmonary fibrosis (IPF), this regenerative process is abnormal but the underlying mechanisms remain unclear. Here, using human lung tissue that represents different stages of disease and a 33-plex single-cell imaging mass cytometry (IMC), we present a high-resolution, temporo-spatial cell atlas of the regenerating alveolar niche. With unbiased mathematical methods which quantify statistically enriched interactions, CD206himacrophage subtype and an alveolar basal intermediate epithelial cell emerge as the most statistically robust spatial association in the epithelial and immune cell interactome, found across all stages of disease. Spatially resolved receptor-ligand analysis further offers an in silico mechanism by which these macrophages may influence epithelial regeneration. These findings provide a foundational step toward understanding immune-epithelial dynamics in aberrant alveolar regeneration in IPF.


Conflict of interest statement

Competing interests: The authors declare no competing interests apart from JS who is part of the Scientific Advisory Board for Mogrify (fees to Newcastle University).

Figures

Fig. 1
Fig. 1. Overall outline of study, the regenerating alveolar niche in IPF lungs and its cellular constituents.
ak overall workflow of study from macroscopic selection of lung biopsy (b) to final analysis (k). l Representative ROIs from lung sections obtained in Early, Intermediate (Intm) and Advanced (Adv) lung regions (see b) showing histopathology features (e.g., collagen deposition, alveolar metaplasia, inflammatory infiltrate and smooth muscle hyperplasia) and matching MCD images stained with metal tagged antibodies—five of 33 markers shown. Lung sections are representative of n = 19 Early, n = 20 Intm and n = 14 Adv ROIs. Staining performed once. m Representative ROI from an H&E-stained IPF lung section showing criteria for ROI selection (presence of AT II metaplasia, immune cell infiltrate and lack of airways). n Metal-tagged antibody panel used for Imaging Mass Cytometry (IMC) staining (o). UMAP (front and back of 3 dimensional projection) of annotated cell clusters derived from 33 plex IMC staining. H&E hematoxylin and eosin, FFPE formalin fixed paraffin embedded, AT II type 2 alveolar epithelial cells, Neut neutrophils, mac macrophages, mono monocytes, SM smooth muscle, ABI aberrant basal intermediates. Hereon, where relevant, Early stage is depicted by green colour, Intm by blue and Adv by red.
Fig. 2
Fig. 2. Composition of alveolar epithelial and immune cells and their correlations in regenerating alveolar niche in IPF lungs.
a Representative ROI from Early disease stage showing KRT17/7 and CD206 protein expression (IMC staining). b–e Corresponding cell centroid maps for (a) showing location of ABIs, basal cells and AT II cells. No ABI_b is visible in keeping with their very low numbers. f Expression density plot for EPCAM, KRT17/7, KRT5, Ki67 and ProSP-C for all epithelial cell clusters in alveolar niche. Blue vertical lines represent background staining. ATII cells are the only cells with high ProSP-C expression; they also showed no/low KRT5 expression by gene expression analysis (see Supplementary Fig. 3b, c) and immunofluorescence staining (Supplementary Fig. 6). g High magnification of H&E images from ‘a’ and ‘b’ boxes in (A). These show that the morphology of ABI_a and ABI_b-DC ADJ cells are in keeping with formal histopathology feature of type II alveolar metaplasia. AM- alveolar macrophages. h Proposed points for ABIs, basal cells and ATII cells in the differentiation trajectory of abnormal alveolar epithelium as shown by Kathiriya’s human alveolar organoid studies. Broken blue boxes identifies markers used in our study. Diagram adapted from Kathiriya JJ et al.; AEC 2 – type 2 alveolar epithelial cells. i Proportion (mean, for all 53 ROIs) of different epithelial and immune cells (as % of total epithelial and immune cells, respectively). j Number (cells/mm2 of tissue) of immune (left graph) and epithelial (right graph) cells in Early, Intm and Adv disease stages. Bar plot provided for visualisation, showing mean and S.D. ***p < 0.001 is 7.2e-06 **p < 0.01 is 5.0e-03 [comparison derived using generalised linear model (GLM) model statistics, with area as a normalising factor]. k Correlation in abundance of cells (per mm of tissue) between alveolar epithelial cell types and immune cells. Values are ‘r’ derived using Pearson’s correlation (complete data in Supplementary Fig. 7). Only positive correlation shown; grey boxes—no significant correlation **p < 0.01; ***p < 0.001; Benjamini—Hochberg correction was applied for multiple comparisons. I Correlation plots for ABI-immune cell pairs with three highest r values for each disease stage (as shown in k). All analyses performed on data derived from 53 ROIs, n = 7 patients (see Fig. 1). Source data are available in Source Date File.
Fig. 3
Fig. 3. Spatial co-location between aberrant regenerating alveolar epithelial cells and immune cells.
a Work flow and findings for each step of spatial analysis b Heat map showing g(r = 20) values for all structural vs all immune cell types. Red rectangular outline indicates g(r = 20) for alveolar epithelial vs immune cell types. Broken white circles and red triangles indicate alveolar epithelial - immune cell pairs with g(r = 20) > 1. Black squares - no co-location above complete spatial randomness [g(r = 20) < 1]. Full spatial data in Source Data File (tab for Figs. 3b, 4a–b, 5). c g(r) plots for the 5 co-locating alveolar epithelial-immune cell pairs from r = 0-300 μm. g_max = peak g(r) value in area around cell centroid of specifiied cell type from r = 0-300um; g(r = 20) = g(r) at 20 μm. d–f Cell centroid maps for CD206hi macrophage-ABI_b-DC ADJ pairs across the three disease stages, with their topographical correlation map (TCM). TCM visualises how the spatial correlation between two cell types changes across an ROI (here, ABI_b-DC ADJ and CD206hi macrophages). Γab scale indicates spatial proximity of cell type B to cell type A within a radius of r (in this case 100μm). High positive values indicate closer spatial proximity compared to complete spatial randomness. g, h Output for Neighbourhood Correlation Function (NCF) which interrogates co-location of 3 (rather than 2) cell types. Here, triplets of ABI_b-DC ADJ, ABI_a, CD206hi macrophages, CD206mid macrophages and CD103+ CD4 T cells (selected due to their co-location as pairs) are tested. Graphs shows NCFC1C2C3r for all triplet (C1C2C3) combinations of ABI (ABI_b-DC ADJ and ABI_a) to immune cells (CD206hi macrophages, CD103+ CD4 T cells) at MEC radius of 20 μm (G) and 30 μm (H). Green pane – triplets containing CD103+ CD4 T cells; blue pane – triplets without CD103+ CD4 T cells. Error bars correspond to the 95% confidence interval around median, derived by bootstrapping for each displayed NCFc1,c2,c3(r = 30), based on the number of MECs at the 5th and 95th centile. n = 53 ROIs from 7 patients. i–k Individual NCFC1C2C3r plots for r = 0 to 150 μm for triplets that are most strongly spatially associated with each other compared to one which did not show association (k). Source data are available in Source Date File.
Fig. 4
Fig. 4. Cellular neighborhood of aberrant regenerating alveolar epithelial cells.
a, b Donut charts show g(r = 20) values for all structural, epithelial and immune cell types that are co-located above CSR with ABI_a cell type (a) and ABI_b-DC ADJ cell type (b) for the different stages of disease. Size of segment is proportional to the relative value of g(r = 20). c, d Cell centroid maps showing the location of all cell types depicted in A and B in one representative ROI from Early, Intm and Adv for ABI_b (c) and ABI_b-DC ADJ (d). Colour of the different cell types are matched to the colour of the cell types in the donut charts in (a) and (b). Source data are available in Source Date File.
Fig. 5
Fig. 5. Cell contact networks.
a–c Output for Cell Contact Network (CCN) for alveolar epithelial -immune cell pairs, depicting pairs of cell type A (here. alveolar epithelial cell types) that are in contact with at least one of cell type B (here, immune cell types) at a frequency greater than expected under complete spatial randomness (CSR), and where z score between observed and random contact has p < 0.05 (shown as bubbles). Broken circles Identify pairs of alveolar epithelial cell-immune cell types (we have not included pairs containing _UD cell types). Immune-immune or epithelial- epithelial pairings. Pairs with ‘UD’ cell clusters are not circled. Left upper quadrant - ‘anchor cells’ are alveolar epithelial cell; right lower quadrant output mirrors the left upper quadrant but ‘anchor cells’ are immune cell types. d–f CCN network for all cell type pairs showing ‘communities’ of directly contacting cell pairs (grey and lime coloured spaces). Connecting lines join cell type pairs that are in direct contact with each other with greater frequency than complete spatial randomness, and with z scores that have FDR q values < 0.05. Size of nodes represents number of cells per mm2, thickness of lines represents number of contacts between cell types A and B. Grey spaces—communities of immune cells (purple nodes); lime spaces—communities of alveolar epithelial cells (yellow nodes). Note we have included the UD’s in the network to show all cell types. Broken circles highlight ABI_b-DC ADJ and CD206hi macrophage pairs, which at all stages, link up aberrant alveolar epithelial communities with immune cell communities. Source data are available in Source Date File.
Fig. 6
Fig. 6. Receptor-ligand analysis between aberrant basaloid intermediates and CD206hi macrophages.
a Data extracted from of single cell RNA sequencing of lung digest cells from IPF (n = 12) and healthy control (n = 12) lungs deposited by Habermann et al. reproduced here to demonstrate starting point for further clustering of macrophages. This UMAP retains Habermann’s annotations. Text in red identifies Habermann’s aberrant basaloid intermediate cells (KRT5-KRT17+ cells) and transitional AT II cells, and in blue the two clusters of DCs. Monocytes (Mono) and Macrophage (Mac) cell clusters in broken blue circle are re-clustered (using 0.7 resolution in Seurat) to discriminate levels of CD206 (MRC1) gene expression and where there is a clear CD206hi subcluster (subcluster 9) shown in (b) and (c). Cluster 9 (in broken box) (c) showing the highest CD206 expression is annotated as CD206hi macrophages. d–e Receptor-ligand analysis using CellChat, with ABI as sender and CD206hi macrophages, cDC and pDC as receivers (d) and vice versa (e). Red circles - highest probability of communication (>0.5); large bubbles indicate probability of communication > 0.3, and small bubble < 0.3; no bubble—no communication detected. Colour of the bubble represents levels of communication probability. Y axis – ligand-receptor; x axis ABI - immune cell pairs. tAT2—Transitional ATII; 'prob'—communication probability (f) Marker gene list for Cluster 9 (CD206hi macrophages) compared to the established macrophage subclusters (FABP4+ macrophage and SPP1+ macrophage),, found in IPF. Note that cluster 9 (CD206hi macrophages) shows a distinct difference in fibronectin (FN) expression compared to FABP4+ macrophage and SPP1+ macrophage subsets. g Confocal picture of immunofluorescent staining of FN in CD206+ macrophages in one of our IPF lungs (one of 16 ROIs shown, n = 3 patients). h Schema proposing location of ABIs and CD206hi macrophages, and functional consequences of receptor-ligand engagement. 'MIF' - macrophage migration inhibitory factor, 'mac' - macrophages.

References

    1. Chacón-Martínez, C. A., Koester, J. & Wickström, S. A. Signaling in the stem cell niche: regulating cell fate, function and plasticity. Development10.1242/dev.165399 (2018). - PubMed
    1. Scadden, D. avidT. Nice neighborhood: emerging concepts of the stem cell niche. Cell157, 41–50 (2014). - PMC - PubMed
    1. Alysandratos, K. D., Herriges, M. J. & Kotton, D. N. Epithelial stem and progenitor cells in lung repair and regeneration. Annu Rev. Physiol.83, 529–550 (2021). - PMC - PubMed
    1. Lederer, D. J. & Martinez, F. J. Idiopathic pulmonary fibrosis. N. Engl. J. Med378, 1811–1823 (2018). - PubMed
    1. Shenderov, K., Collins, S. L., Powell, J. D. & Horton, M. R. Immune dysregulation as a driver of idiopathic pulmonary fibrosis. J. Clin. Invest.10.1172/JCI143226 (2021). - PMC - PubMed

MeSH terms

LinkOut - more resources