. 2025 Aug 4;8(1):501.
doi: 10.1038/s41746-025-01905-7.

Determinants of depressive symptoms in multinational middle-aged and older adults

Affiliations

Determinants of depressive symptoms in multinational middle-aged and older adults

Can Lu et al. NPJ Digit Med. .

Abstract

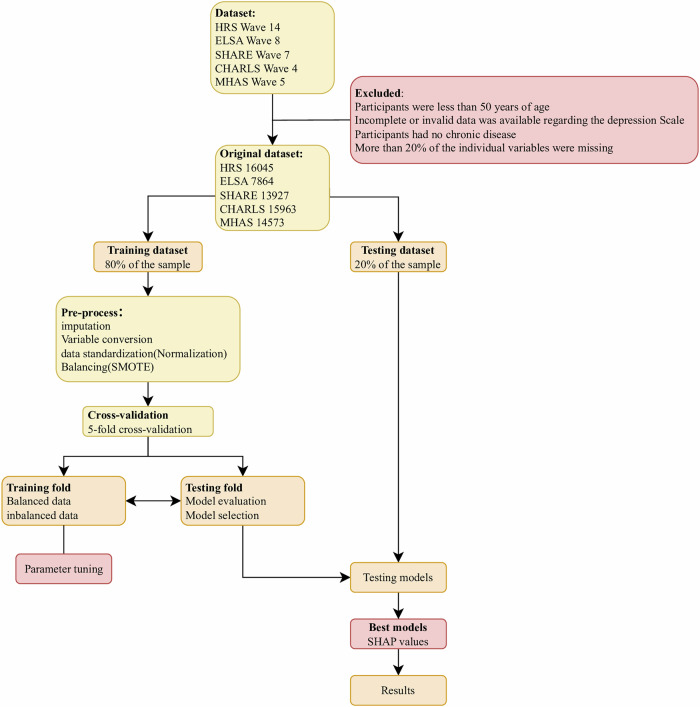
This study harnesses machine learning to dissect the complex socioeconomic determinants of depression risk among older adults across five international cohorts (HRS, ELSA, SHARE, CHARLS, MHAS). Evaluating six predictive algorithms, XGBoost demonstrated superior performance in four cohorts (AUC 0.7677-0.8771), while LightGBM excelled in ELSA (AUC 0.9011). SHAP analyses identified self-rated health as the predominant predictor, though key factors varied notably-gender was especially influential in MHAS. Stratified analyses by income and sex revealed marked heterogeneity: wealth, employment, digital inclusion, and marital status exerted greater influence in lower-income groups, with distinct gender-specific patterns. These findings highlight machine learning's capacity to reveal nuanced, context-dependent risk profiles beyond traditional models, emphasizing the need for tailored interventions that address the diverse vulnerabilities of aging populations, particularly those socioeconomically disadvantaged.


Conflict of interest statement

Competing interests: The authors declare no competing interests.

Figures

Fig. 1
Fig. 1. ROC curves of machine learning models in internal and external validation for each cohort.
The figure presents the Receiver Operating Characteristic (ROC) curves demonstrating the performance of the machine learning models during internal and external validation phases for each cohort. Panels (ae) correspond to the SHARE, MHAS, ELSA, HRS, and CHARLS databases, respectively. The ROC curves plot sensitivity versus 1-specificity, illustrating the discriminative ability of the models to predict the target outcome. The area under the curve (AUC) values indicate the accuracy of the models, with higher AUC representing better predictive performance. This figure provides a comparative visualization of model efficacy across diverse population cohorts.
Fig. 2
Fig. 2. SHAP analysis of the best machine learning model prediction in each cohort.
This figure displays the SHapley Additive exPlanations (SHAP) analysis results for the top-performing machine learning model in each cohort. Each horizontal row corresponds to an individual feature, and the x-axis represents the SHAP value, which quantifies the impact of that feature on the model’s prediction. Panels (ae) represent the SHARE, MHAS, ELSA, HRS, and CHARLS databases, respectively. Data points are color-coded, with red indicating higher feature values and blue indicating lower values, allowing visualization of the direction and magnitude of feature influence. This analysis provides interpretability by identifying key predictors driving model decisions.
Fig. 3
Fig. 3. Feature importance values predicted by the best machine learning model for each cohort.
This figure illustrates the relative importance of features as determined by the best-performing machine learning model within each cohort. Panels (ae) correspond to the SHARE, MHAS, ELSA, HRS, and CHARLS databases, respectively. Feature importance scores reflect the contribution of each variable to the predictive accuracy of the model. The figure highlights the most influential predictors across different cohorts, offering insights into cohort-specific factors that significantly affect the outcome. This comparative analysis aids in understanding variable relevance and potential heterogeneity among populations.
Fig. 4
Fig. 4. Income heterogeneity of the sample across income levels in each cohort.
This figure depicts the distribution and heterogeneity of income levels within the sample populations of each cohort. Panels (ae) represent the SHARE, MHAS, ELSA, HRS, and CHARLS databases, respectively. The figure shows how income varies across different subgroups within each cohort, revealing patterns of economic diversity and stratification. This visualization helps to contextualize the socioeconomic background of participants and assess how income disparities may influence study outcomes or model predictions.
Fig. 5
Fig. 5. Gender heterogeneity of the sample across income levels in each cohort.
This figure presents the gender distribution across different income levels within each cohort sample. Panels (ae) correspond to the SHARE, MHAS, ELSA, HRS, and CHARLS databases, respectively. The figure illustrates variations in gender representation within income strata, highlighting potential gender-related socioeconomic differences. Understanding gender heterogeneity is critical for interpreting model results and ensuring that predictive models account for demographic diversity.
Fig. 6
Fig. 6. Flowchart of the combined prediction study in each cohort.
This figure illustrates the step-by-step flowchart of the study design used to develop and validate the combined and overall prediction models across multiple cohorts. It details the data preprocessing, feature selection, model training, internal validation, and external validation processes applied to each cohort dataset. The flowchart highlights the integration of five cohort databases (SHARE, MHAS, ELSA, HRS, CHARLS) and the sequential steps to ensure robust machine learning model development and evaluation. This visual guide provides a comprehensive overview of the methodology, ensuring reproducibility and clarity of the study workflow.

References

    1. Li, S. et al. Uncovering the heterogeneous effects of depression on suicide risk conditioned by linguistic features: A double machine learning approach. Comput. Hum. Behav.152, 108080 (2024).
    1. Chirico, A. et al. Exploring the Psychological Nexus of Virtual and Augmented Reality on Physical Activity in Older Adults: A Rapid Review. Behav. Sci.14, 31 (2023). - PMC - PubMed
    1. Abu Hatab, A., Cavinato, M. E. R., Lindemer, A. & Lagerkvist, C.-J. Urban sprawl, food security and agricultural systems in developing countries: A systematic review of the literature. Cities94, 129–142 (2019).
    1. Tu, W.-J., Zeng, X. & Liu, Q. Aging tsunami coming: the main finding from China’s seventh national population census. Aging Clin. Exp. Res.34, 1159–1163 (2022). - PubMed
    1. Angelsen, A. et al. Environmental Income and Rural Livelihoods: A Global-Comparative Analysis. World Dev.64, S12–S28 (2014). - PMC - PubMed

LinkOut - more resources