. 2025 Aug;7(8):1663-1680.
doi: 10.1038/s42255-025-01331-9. Epub 2025 Aug 4.

Lactate signalling leads to aggregation of immune-inflammatory hotspots and SLC5A12 blockade promotes their resolution

Affiliations

Lactate signalling leads to aggregation of immune-inflammatory hotspots and SLC5A12 blockade promotes their resolution

Michelangelo Certo et al. Nat Metab. 2025 Aug.

Abstract

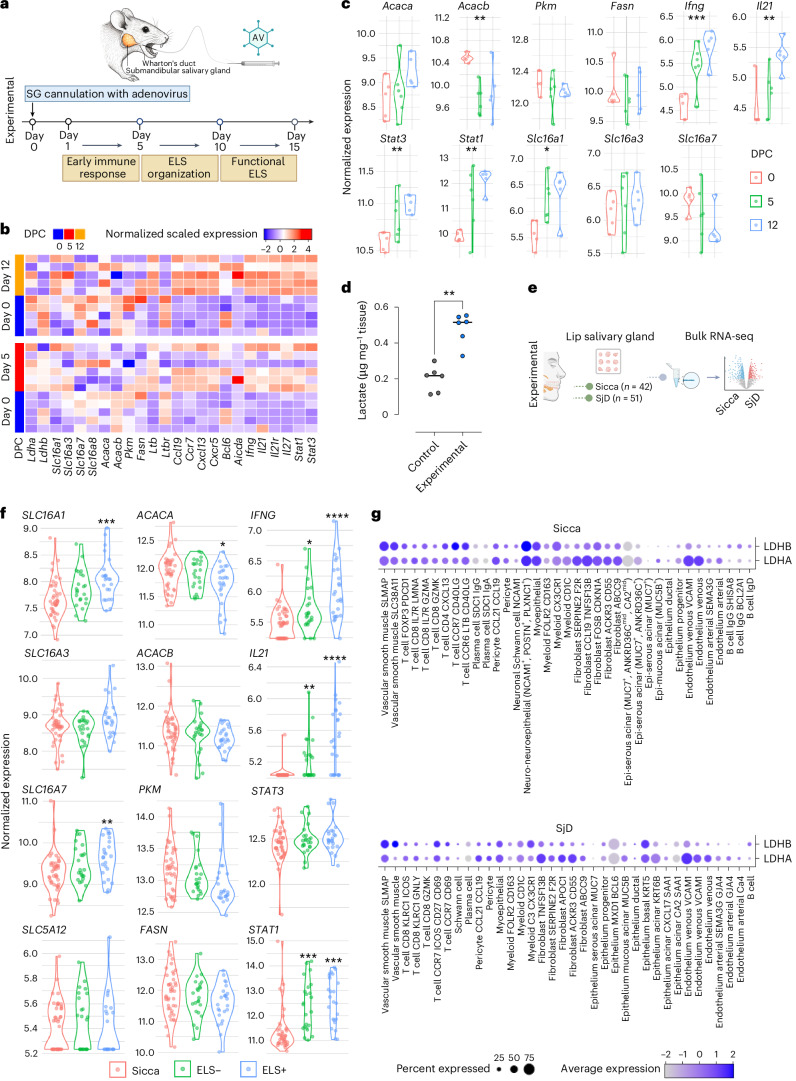
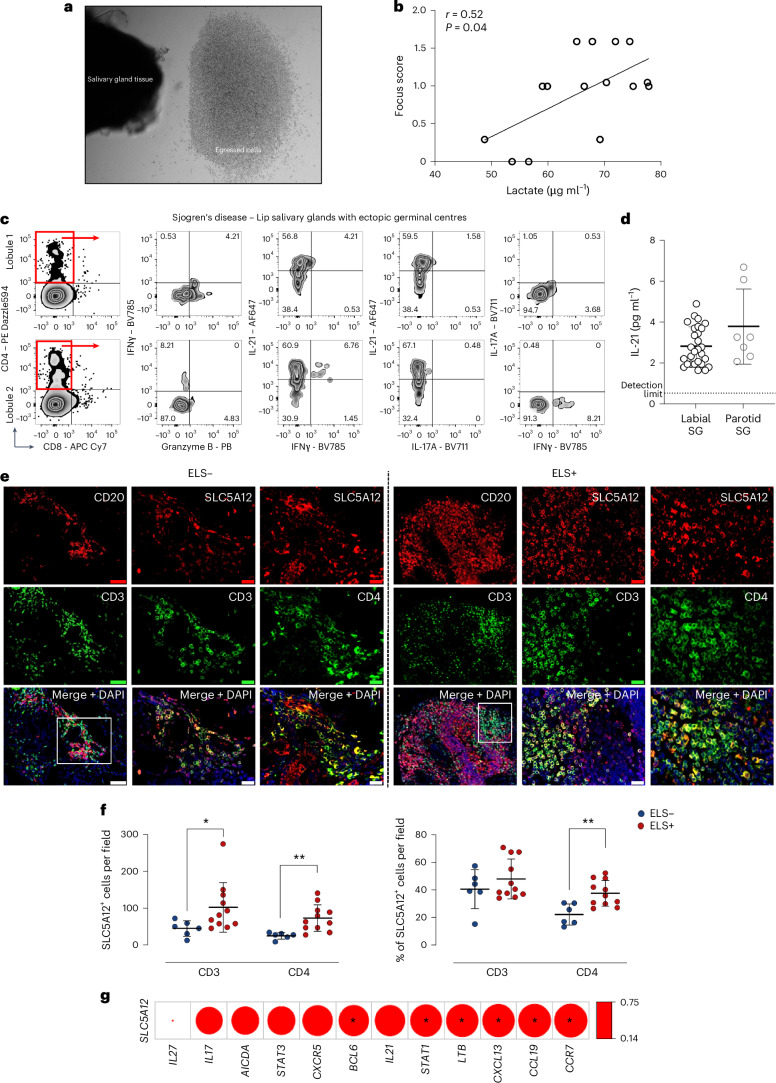
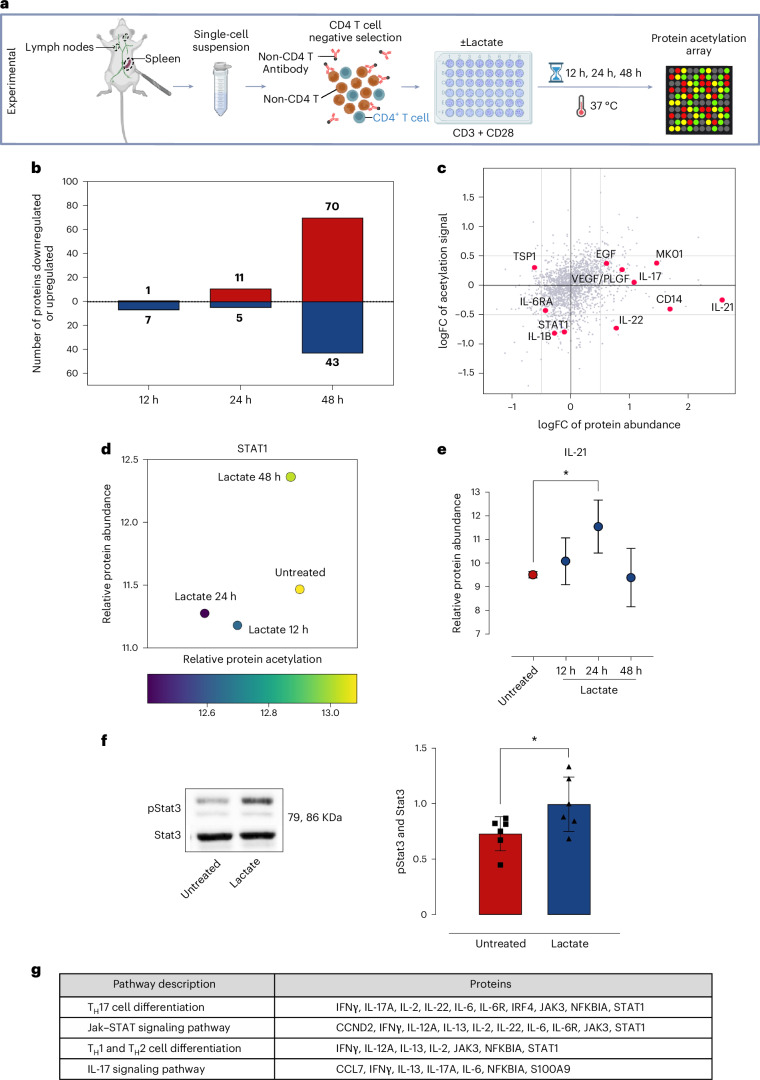
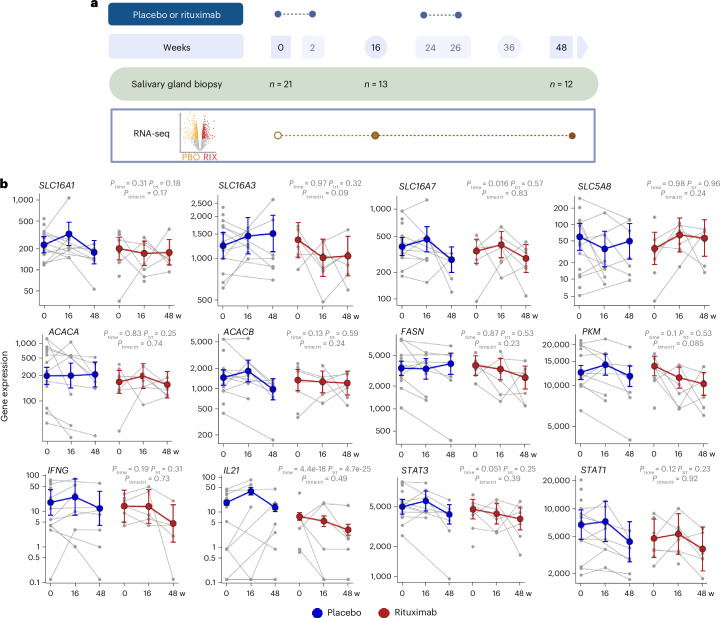
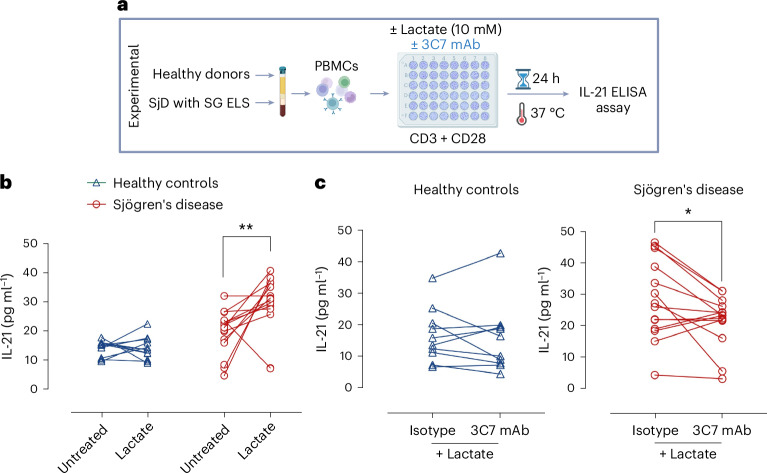
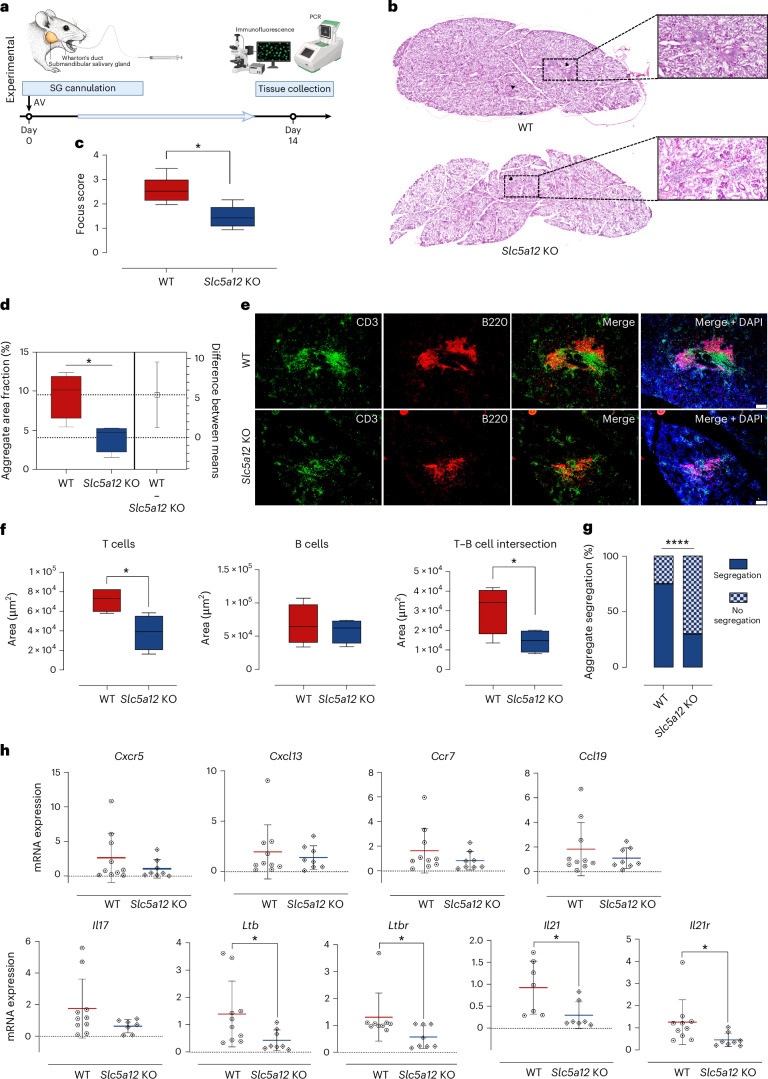
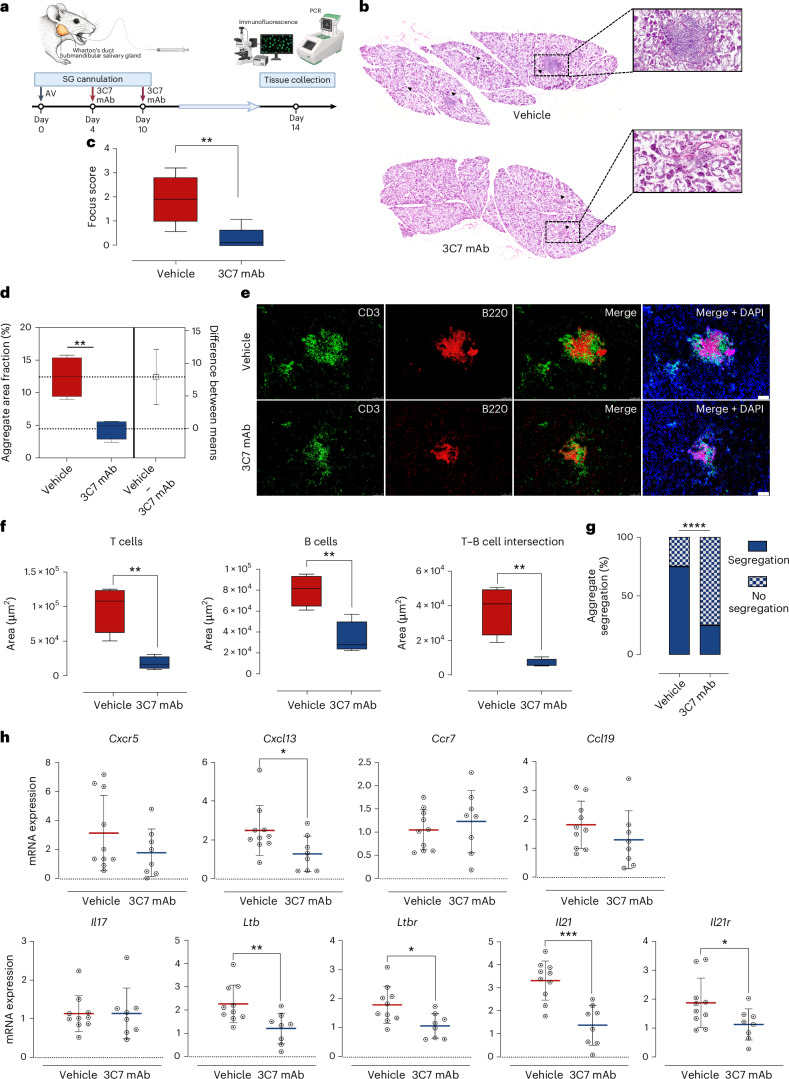
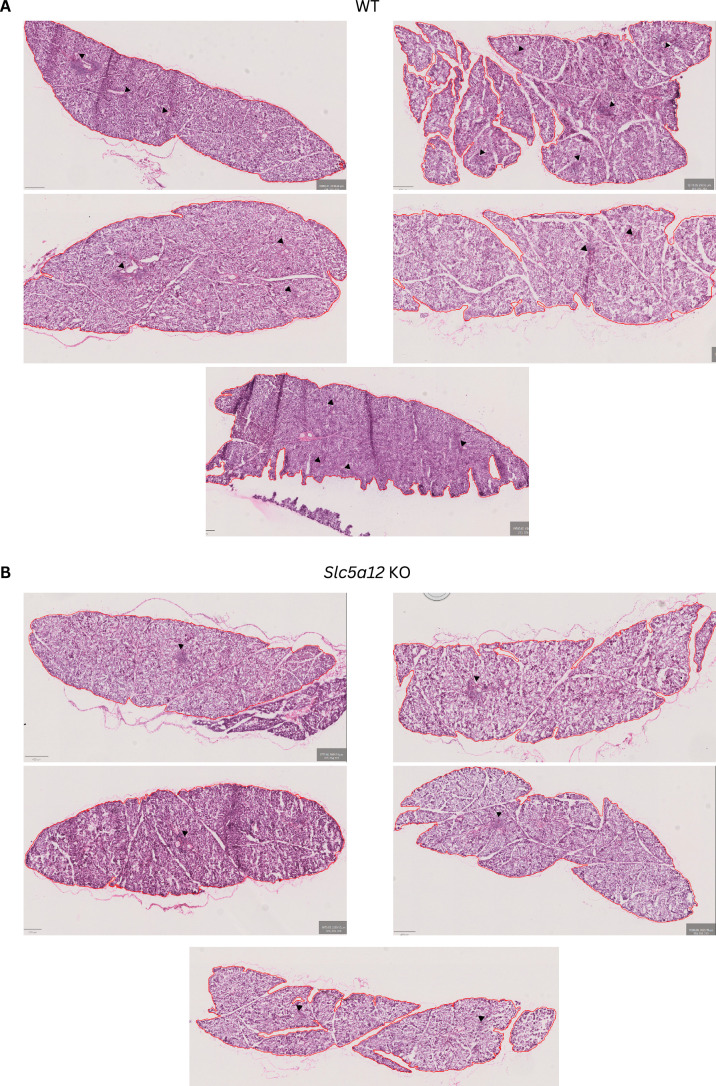
Ectopic lymphoid structures (ELS) are aggregates of lymphoid cells that often form within inflamed tissues in patients with autoimmune diseases, cancer, infectious diseases and cardiovascular conditions. These structures drive B cell maturation into memory B cells and plasma cells through B cell and T cell co-stimulation, and their role in pathogenesis is increasingly recognized. Understanding how ELS develop and persist in inflamed tissues is essential for elucidating the pathogenesis and treatment responses in diseases in which they have a prominent role. Here we show that metabolic pathways and specific metabolites, in particular lactate, are master regulators of ELS organization in Sjögren's disease (SjD), the second-most common autoimmune rheumatic disease. Furthermore, inhibiting lactate uptake by lactate transporters, specifically by SLC5A12 blockade, represents a previously unappreciated checkpoint in autoimmune inflammatory diseases. This approach results in multidimensional pro-resolution effects, including reduced inflammatory cytokine levels, enhanced T cell egress from inflamed sites and diminished T cell and B cell areas and their segregation within ELS.


Conflict of interest statement

Competing interests: C.M. is a founder and CSO of Solute Guard Therapeutics (SGTx). M.B. is a member of the scientific advisory board of SGTx. The other authors declare no competing interests.

Figures

Fig. 1
Fig. 1. Transcriptomic analysis and lactate quantification in SG tissue.
a, Workflow of the murine sialadenitis model, showing a representation of the mouse submandibular SG and the cannula used for the delivery of the AdV (AV) vector into the gland. The timeline depicts ELS formation within the SGs following injection of the AdV type-5 vector. b, Supervised heatmap of differentially expressed genes from bulk RNA-seq of murine SGs collected at 0, 5 and 12 days post cannulation (DPC). c, Expression levels of selected genes related to lactate transporters, metabolic enzymes downstream of lactate signalling and inflammatory mediators in murine SGs collected at 0, 5 and 12 days post cannulation (n = 10 per time point). Adjusted P values calculated using DESeq2 (*P < 0.05, **P < 0.01, ***P < 0.001, ****P < 0.0001). d, Lactate concentrations in SGs from non-cannulated (control) and cannulated (experimental) mice at day 5 (n = 6 glands per group). Data are expressed as means, normalized to tissue weight; error bars, s.d. Statistical significance was assessed using the Mann–Whitney U-test, **P < 0.01. e, Schematic overview of the bulk RNA-seq workflow used for analysing human SG tissue. f, Expression levels of selected mRNA transcripts related to lactate transporters, metabolic enzymes downstream of lactate signalling and inflammatory mediators in human SGs. This comparison involves sicca and SjD SGs classified as ELS− or ELS+ based on histological analysis of matched biopsies (adjusted P values calculated by DESeq2, *P < 0.05, **P < 0.01, ***P < 0.001, ****P < 0.0001). g, Scaled average expression and the percentage of cells with any expression of lactate dehydrogenase (LDHA or LDHB) mRNA transcripts per cell cluster in both SjD and non-SjD sicca SGs. Data were generated from disaggregated minor labial SG biopsies (n = 7 patients per disease).
Fig. 2
Fig. 2. In vitro SG organ culture and immune cell dynamics in SjD.
a, Representative images of the in vitro SG organ culture system showing a lip SG lobule from a patient with SjD and the immune cells spontaneously egressing from the tissue. b, Correlation plot of the lactate levels measured in the supernatant of the SG organ culture from an SjD patient and the focus score (a histopathological index of SG inflammatory infiltrate severity) of the corresponding lip SG lobule. Spearman correlation coefficient (r) and P value (two-sided) are shown. c, Representative flow cytometry plots showing cytokine production by CD4 T cells egressed from the lip SG in the organ culture system. Cytokine production is shown for T cells obtained from a lip SG with low inflammation (lobule 1, focus score of <1) and severe inflammation (lobule 2, focus score of >1.5). d, Detection of IL-21 in the supernatant of SG organ cultures derived from lip (n = 30) and parotid (n = 7) SGs of patients with SjD. e, Representative images of lip SGs from patients with SjD, classified based on the absence (ELS−) or presence (ELS+) of ectopic lymphoid structures. The left columns show B cell (CD20) and T cell (CD3) immune infiltration and their segregation. The middle and right columns depict SLC5A12 expression in all T cells (CD3) and specifically in TH cells (CD4). Scale bars, 100 µm. f, Comparison of cell count (left) and percentages (right) of CD3 T cells and CD4 TH cells expressing SLC5A12 in ELS− (n = 6) and ELS+ (n = 11) SGs from patients with SjD. Each dot represents an aggregate. Data are expressed as means, error bars, s.d. Statistical significance was determined using the Mann–Whitney U-test between groups (*P < 0.05, **P < 0.01). g, Correlation matrix of SLC5A12 expression with inflammatory mediator genes relevant for ELS formation and function. Gene expression was evaluated using real-time PCR (n = 18). The size of the circles represents the magnitude of each correlation, and the colour indicates the Spearman correlation coefficient (r). Statistically significant adjusted P values (adjusted for multiple testing with false discovery rate correction) are shown within the dots (*P < 0.05).
Fig. 3
Fig. 3. Acetylation study of murine CD4 T cells.
a, Experimental workflow for the acetylation study of murine CD4 T cells. Lymph nodes and spleen were collected from mice and processed to obtain a single-cell suspension, from which CD4 T cells were isolated. The isolated CD4 T cells were then activated with CD3 and CD28 and treated with lactate or left untreated for 12, 24 and 48 h. The cells were then used to perform a protein acetylation array to assess abundance and levels of acetylation. b, Bar graph listing the number of antibodies with differential intensities when comparing untreated versus lactate-treated (12 h, 24 h and 48 h) CD4 T cells. For each comparison, red indicates upregulated proteins, while blue indicates downregulated proteins. c, Overview of differences in protein abundance and acetylation levels between untreated and lactate-treated (24 h) CD4 T cells. FC, fold change. d, Overview of differences in STAT1 abundance and acetylation levels between untreated and lactate-treated (12 h, 24 h and 48 h) CD4 T cells. e, Relative IL-21 levels in untreated and lactate-treated (12 h, 24 h and 48 h) CD4 T cells. For analysis of the samples, a one-factorial linear model was fitted with LIMMA, resulting in a two-sided t-test (*P < 0.05). Each sample was measured by four replicate spots per array (n = 3 biological replicates). f, Western blot analysis showing the levels of pStat3 and total Stat3 in CD4 T cells. The cells were either left untreated or treated with lactate for 24 h. Data are presented as mean values; error bars, s.d. Statistical significance was assessed using the Mann–Whitney U-test (*P < 0.05, n = 6 biological replicates). g, Selected KEGG pathways related to proteins with differential abundance and acetylation in untreated versus lactate-treated (24 h) CD4 T cells.
Fig. 4
Fig. 4. Longitudinal transcriptomic profiling of SG tissue in the TRACTISS trial.
a, Schematic of the longitudinal transcriptomic study from the TRACTISS randomized clinical trial in patients with SjD, including sequential lip biopsies from patients randomized to either placebo (PBO) or rituximab (RIX) (anti-CD20 B cell depleting agent) treatment. b, Changes over time in the expression of genes for lactate transporters, metabolic enzymes downstream of lactate signalling and inflammatory mediators. Blue (placebo) and red (rituximab) lines represent the fitted negative binomial mixed-effects model with a 95% confidence interval. The P values of the week/treatment ratio interaction model are shown on top. Data from patients with SjD treated with placebo (n = 12) or rituximab (n = 8) are included.
Fig. 5
Fig. 5. Quantification of IL-21 in ex vivo PBMCs from patients with SjD.
a, Schematic representation of the IL-21 quantification workflow from ex vivo supernatant. b, Levels of IL-21 in culture supernatant of PBMCs from patients with SjD with SG ELS (n = 15) and from healthy donors (n = 12), stimulated in the absence and presence of lactate (10 mM). Lines connect dots representing PBMC samples treated with lactate or left untreated from the same donor. Statistical analysis was performed using the Wilcoxon signed-rank test (*P < 0.05, **P < 0.01). c, Levels of IL-21 in culture supernatant of PBMCs from patients with SjD, stimulated with lactate (10 mM) and treated with either anti-SLC5A12 3C7 mAb or its isotype control. Lines connect dots representing PBMC samples treated with anti-SLC5A12 mAb and its isotype control from the same donor. Statistical analysis was performed using the Wilcoxon signed-rank test; P value (two-sided) is shown (*P < 0.05).
Fig. 6
Fig. 6. Histological analysis, immune characterization and gene expression quantification in wild-type and Slc5a12 KO murine SGs.
a, Workflow of the cannulation of murine SGs in wild-type (WT) and Slc5a12 knockout (KO) mice model showing a representation of the mouse SG, and the cannula used for precise delivery of the AV into the gland. The experimental timeline shows that the AV was injected into the SG on day 0, and on day 14, SG tissues were collected for subsequent analyses. Post collection, tissues were processed for immunofluorescence and qPCR to assess relevant biomarkers and gene expression levels. b, Representative images of hematoxylin and eosin (H&E) staining of the whole SGs from WT and Slc5a12 KO mice. Black arrows point to inflammatory foci (peri-ductal leukocytic infiltrates with more than 50 lymphocytes). c, Comparison between WT and Slc5a12 KO mice (n = 5 per group) of focus score calculated on H&E images. d, Aggregate area fraction (% of SG area occupied by the inflammatory infiltrate), measured on immunofluorescence stainings. e, Representative immunofluorescence staining of SG tissue sections from WT and Slc5a12 KO mice. CD3 (green) is used as a marker for T cells, B220 (red) is used as a marker for B cells and DAPI (blue) is used as a marker for nuclei. The images reveal the distribution and localization of T cell and B cell inflammatory aggregates in the tissue. Scale bars, 100 µm. f, Comparison between WT and Slc5a12 KO mice of positive area for CD3 (T cells), B220 (B cells) and both (T cell–B cell intersection), respectively, as calculated from e. Data are presented as means; error bars, s.d. (n = 4 biological replicates per group). Statistical analysis was performed using an unpaired t-test. In c, d and f, box and whisker plots show the 75th and 25th percentiles of the data, and minimum and maximum values. Statistical significance was determined using a Mann–Whitney U-test (two-sided). g, Prevalence of segregated and non-segregated aggregates over the total number in WT and Slc5a12 KO mice, as calculated from e. h, qPCR analysis of gene expression levels for Cxcr5, Cxcl13, Ccr7, Ccl19, Ltb, Ltbr, Il17, Il21 and Il21r in WT and Slc5a12 KO mice. Gene expression levels are normalized to a housekeeping gene and presented as relative expression levels. Data are expressed as means from n = 8–10 mice per group; error bars, s.d. Statistical significance was determined using a Mann–Whitney U-test (two-sided) and outliers were excluded by Grubb’s test (*P < 0.05, **P < 0.01, ***P < 0.001, ****P < 0.0001).
Fig. 7
Fig. 7. Histological analysis, immune characterization and gene expression quantification in vehicle and 3C7 mAb-injected murine SGs.
a Workflow of the mouse inducible ELS formation, following SGs cannulation. The experimental timeline shows that the AV was injected into the SG on day 0; on days 4 and 10, the 3C7 monoclonal anti-Slc5a12 antibody was administered. On day 14, SG tissues were collected for subsequent analyses. Post collection, tissues were processed for immunofluorescence and qPCR to assess relevant biomarkers and gene expression levels. b, Representative images of H&E staining of the whole SGs from vehicle-cannulated and 3C7 mAb-cannulated mice. Black arrows point to inflammatory foci (peri-ductal leukocytic infiltrates with more than 50 lymphocytes). c,d, Comparison between vehicle-cannulated and 3C7 mAb-cannulated mice (n = 5 or 6 per group) of focus score calculated on H&E images (c) and aggregate area fraction (% of SG area occupied by the inflammatory infiltrate), calculated on immunofluorescence images (d). e, Representative immunofluorescence staining of SG tissue sections from vehicle and 3C7 mAb-injected mice. CD3 (green) is used as a marker for T cells, B220 (red) is used as a marker for B cells and DAPI (blue) is used as a marker for nuclei. The images reveal the distribution and localization of T cells and B cells in the tissue and their segregation. Scale bars, 100 µm. f, Comparison between vehicle and 3C7 mAb-cannulated mice of the positive area for CD3 (T cells), B220 (B cells) and both (T cell–B cell intersection), respectively, as calculated from e. Data are presented as means; error bars, s.d. (n = 4 biological replicates per group). Statistical analysis was performed using an unpaired t-test. In c, d and f, box and whisker plots show the 75th and 25th percentiles of the data, and minimum and maximum values. Statistical significance was determined using a Mann–Whitney U-test (two-sided). g, Prevalence of segregated and non-segregated aggregates over the total number in vehicle and 3C7 mAb-cannulated mice, as calculated from e. h, qPCR analysis of gene expression levels for Cxcr5, Cxcl13, Ccr7, Ccl19, Ltb, Ltbr, Il17, Il21 and Il21r in vehicle and 3C7 mAb-injected mice. Gene expression levels are normalized to a housekeeping gene and presented as relative expression levels. Data are expressed as means from n = 8–10 mice per group; error bars, s.d. Statistical significance was determined using a Mann–Whitney U-test and outliers were excluded by Grubb’s test (*P < 0.05, **P < 0.01, ***P < 0.001, ****P < 0.0001).
Extended Data Fig. 1
Extended Data Fig. 1. Gene expression and correlation analysis of inflammatory mediators in salivary glands.
(a) Expression levels of selected genes related to inflammatory mediators involved in ectopic lymphoid structure (ELS) formation and function in murine salivary glands collected at 0-, 5-, and 12-days post-cannulation. Adjusted p-values calculated by DESeq2 (*p < 0.05, **p < 0.01, ***p < 0.001, ****p < 0.0001). (b) Flow cytometry gating strategy showing the phenotype of CD4+ T cells producing IL21 (top panel). Frequency of IL21-producing T CD4+ cells with a Tfh-phenotype (CD4 + / CXCR5 + , bottom left panel), and frequency of IL21+ cells in the Tfh cell population (CD4 + / CXCR5 + /PD1 + , bottom right panel) in murine salivary glands collected at 0-, 5-, and 12-days post-cannulation.Data are expressed as mean ± SD from n = 13 glands per group. (c) Unsupervised heatmap of differentially expressed genes (DEGs) comparing SjD patients versus sicca controls. (d) Immunohistochemistry staining of human kidney tissue using anti-SLC5A12 antibody. (e) Correlation plots of SLC5A12 expression with inflammatory mediator genes relevant to ELS formation and function. Gene expression was evaluated using real-time PCR (n = 18). Spearman correlation coefficient (r) and p-values (two-sided) are shown.
Extended Data Fig. 2
Extended Data Fig. 2. Protein expression analysis.
Volcano plots illustrating the results of the differential expression analysis comparing untreated and lactate-treated (12 h a, 24 h b, and 48 h c) CD4 T cells. Each point on the plot represents a single protein. P values (adjusted for multiple testing) and corresponding log-fold changes (logFC) are shown. A significance level of adj. p-value = 0.05 is indicated as a horizontal red line. The logFC cutoffs are indicated as vertical lines. Proteins with a positive logFC had a higher abundance in lactate-treated samples, proteins with a negative value in untreated samples. Proteins indicated with green points feature a logFC > 1, while not reaching the significance threshold. (d) Individual array values for a set of differential proteins in untreated and lactate-treated (12 h, 24 h, and 48 h) CD4 T cells. Each sample is measured by four replicate spots per array. For analysis of the samples a one-factorial linear model was fitted with LIMMA resulting in a two-sided t-test. Data are presented as mean values +/- SD (*p < 0.05, n = 3 biological replicates).
Extended Data Fig. 3
Extended Data Fig. 3. Differential protein abundance versus acetylation level.
Overview of differences in protein abundance as well as acetylation levels between untreated and lactate-treated (12 h a, and 48 h b) CD4 T cells. Proteins with a positive logFC (protein, x-axis) were more abundant in lactate-treated samples, while proteins with a negative logFC were more abundant in untreated samples. For proteins with a positive logFC (acetyl, y-axis), higher acetylation signals were obtained in lactate-treated samples. For proteins with a negative logFC, higher acetylation signals were obtained in untreated samples. (c) Individual array values for a set of differential proteins in untreated and lactate-treated (48 h) CD4 T cells.
Extended Data Fig. 4
Extended Data Fig. 4. Comparison of inflammatory foci in salivary glands of WT and Slc5a12 KO mice.
Whole-slide images of hematoxylin and eosin (H&E) staining of salivary glands from WT (a) and Slc5a12 KO (b) mice (n = 5 per group), showing differences in the inflammatory foci (peri-ductal leukocytic infiltrates containing more than 50 lymphocytes, black arrows).
Extended Data Fig. 5
Extended Data Fig. 5. Comparison of inflammatory foci in salivary glands of vehicle-cannulated and 3C7 mAb-cannulated mice.
Whole-slide images of hematoxylin and eosin (H&E) staining of salivary glands from vehicle-cannulated (a) and 3C7 mAb-cannulated (b) mice (n = 5/6 pr group), showing differences in inflammatory foci (peri-ductal leukocytic infiltrates containing more than 50 lymphocytes, black arrows).
Extended Data Fig. 6
Extended Data Fig. 6. Mechanisms of ectopic lymphoid structure formation in salivary glands.
The figure illustrates the proposed impact of lactate accumulation on T cell activation and the development of ectopic lymphoid structures in SjD SGs. (Left panel) Activated stromal cells, such as ductal epithelial cells, and infiltrating immune cells increase glycolysis, leading to lactate production and release into the microenvironment. CD4+ T cells uptake lactate via the SLC5A12 transporter. Lactate stimulates IL21 production by Tfh and Tph cells, driving B-cell activation and differentiation. (Right panel) Within the ectopic lymphoid structure, B cells organize into follicles supported by follicular dendritic cells (FDCs). Tfh cells provide help to B cells, leading to the production of autoantibodies and the generation of plasma cells and memory B cells. Autoantigens from the salivary gland epithelial cells contribute to the formation of immune complexes, perpetuating the autoimmune response.

References

    1. Bombardieri, M., Lewis, M. & Pitzalis, C. Ectopic lymphoid neogenesis in rheumatic autoimmune diseases. Nat. Rev. Rheumatol.13, 141–154 (2017). - PubMed
    1. Pitzalis, C., Jones, G. W., Bombardieri, M. & Jones, S. A. Ectopic lymphoid-like structures in infection, cancer and autoimmunity. Nat. Rev. Immunol.14, 447–462 (2014). - PubMed
    1. Petitprez, F. et al. B cells are associated with survival and immunotherapy response in sarcoma. Nature577, 556–560 (2020). - PubMed
    1. Cabrita, R. et al. Tertiary lymphoid structures improve immunotherapy and survival in melanoma. Nature577, 561–565 (2020). - PubMed
    1. Helmink, B. A. et al. B cells and tertiary lymphoid structures promote immunotherapy response. Nature577, 549–555 (2020). - PMC - PubMed

LinkOut - more resources