. 2025 Aug;57(8):1848-1859.
doi: 10.1038/s41588-025-02269-0. Epub 2025 Aug 4.

Uncovering the multivariate genetic architecture of frailty with genomic structural equation modeling

Affiliations

Uncovering the multivariate genetic architecture of frailty with genomic structural equation modeling

Isabelle F Foote et al. Nat Genet. 2025 Aug.

Abstract

Frailty is a multifaceted clinical state associated with accelerated aging and adverse health outcomes. Informed etiological models of frailty hold promise for producing widespread health improvements across the aging population. Frailty is currently measured using aggregate scores, which obscure etiological pathways that are only relevant to subcomponents of frailty. Here we perform a multivariate genome-wide association study of the latent genetic architecture between 30 frailty deficits, which identifies 408 genomic risk loci. Our model includes a general factor of genetic overlap across all deficits, plus six new factors indexing a shared genetic signal across specific groups of deficits. We demonstrate the added clinical and etiological value of the six factors, including predicting frailty in external datasets, highlighting divergent genetic correlations with clinically relevant outcomes and uncovering unique underlying biology linked to aging. We show that nuanced models of frailty are key to understanding its causes and how it relates to worse health.


Conflict of interest statement

Competing interests: Although not directly related to the submitted work, K.R. has asserted copyright over the Clinical Frailty Scale and (with O. Theou) the Pictorial Fit-Frail Scale, which have been made freely available for noncommercial education and research, and nonprofit healthcare via completion of a permission agreement stipulating that users will not change, charge for or commercialize the scales. For-profit entities (including pharma) pay a licensing fee, 15% of which is retained by the Dalhousie University Office of Commercialization and Industry Engagement. After taxes, the remainder of the license fees are donated to the Dalhousie Medical Research Foundation. In the past 3 years, licenses have been negotiated with Renibus Therapeutics, Cook Research Incorporated, W.L. Gore Associates, Pfizer, Cellcolabs AB, AstraZeneca UK, Qu Biologics, Biotest AG, BioAge Labs, Congenica and Icosavax. The other authors declare no competing interests.

Figures

Fig. 1
Fig. 1. Path diagram of the standardized results for our bifactor model of frailty.
All 30 frailty deficits load onto the general factor of frailty (large oval), which is orthogonal to factors 1–6 (that is, residual factors). The small circles represent the 30 measured frailty indicators (that is, genetic variance captured in the univariate GWAS for that phenotype), whereas the medium-size ovals represent latent factors (that is, unmeasured constructs representing genetic overlap (g) between the indicators that load onto them). Single-headed arrows represent a directional genetic correlation between a latent factor and an indicator (that is, factor loadings), whereas curved double-headed arrows represent inter-factor correlations between factors 1 to 6; the s.e. of the correlation coefficients is reported in the parentheses. ASI, pulse wave arterial stiffness index; BFP, body fat percentage; BMR, basal metabolic rate; CIG, number of cigarettes smoked per day; CON, unable to confide; CP, chest pain; DIS, long-standing illness, disability or infirmity; EYE, eye disorder or problem; FALL, number of falls in past year; FIN, financial difficulties; FRA, fracture in last 5 years; GF, low fluid intelligence score; HGS, low hand grip strength; HL, age-related hearing loss; ILL, number of non-cancer illnesses; INS, insomnia; LON, loneliness or isolation; LPA, physical inactivity; LSA, low social or leisure activity; LWS, not living with spouse or partner; MAP, mean arterial pressure; MDD, major depressive disorder; MOT, feelings of unenthusiasm or disinterest; OH, poor oral health; OHR, poorer overall health rating; PAIN, pain experienced in the past month; SOB, shortness of breath when walking on flat ground; TIR, tiredness or lethargy; WHZ, wheezing or whistling in chest in the past year; WP, slow walking pace.
Fig. 2
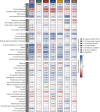
Fig. 2. Heatmap of the genetic correlations between aging-related health outcomes and each of the latent factors from the frailty bifactor model.
Genetic correlations with a two-sided q < 0.05 are in black font. We used FDR correction to account for multiple testing. The blue shading represents a positive genetic correlation, whereas the red shading represents a negative genetic correlation. For visualization purposes, only health outcomes that demonstrated at least one q < 0.05 with one or more of the latent factors are included in this figure (full results can be found in Supplementary Table 5).
Fig. 3
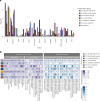
Fig. 3. Manhattan plots of the shared genetic signal for each of the latent factors in the frailty model.
The x axis depicts the chromosomes and the y axis represents the two-sided −log10(P) of the association between each individual SNP and each latent factor. The closest gene to the lead SNP is annotated for the top loci of each latent factor. The dashed line denotes the genome-wide significance threshold adjusted for multiple testing using Bonferroni correction (that is, PBonferroni < 7.14 × 10−9). N^ is the expected sample size of each latent factor implied by the GWAS summary statistics for that factor, which is influenced by the power of the factor loadings of the indicators (that is, frailty deficits) that define it.
Fig. 4
Fig. 4. Results from the MAGMA gene property analysis and stratified genomic SEM.
a, The y axis denotes the one-sided −log10(P) of the enrichment between each latent frailty factor and body tissues from GTEx v.8 (only tissues with significant enrichment are displayed). The dashed line denotes the cutoff for nominal significance (that is, one-sided P < 0.05); the bars marked with an asterisk indicate tissues that remained significantly enriched with the latent frailty factor after adjusting for multiple testing using FDR correction (that is, one-sided q < 0.05). The full results are shown in Supplementary Table 15. b, Heatmaps of the enrichment values calculated using stratified genomic SEM to test for differences in gene expression and epigenetic marks associated with each latent frailty factor in a selection of brain-relevant tissues and cell types. Significant enrichment values that passed FDR correction for multiple testing are marked with an asterisk (that is, one-sided q < 0.05). Full results can be found in Supplementary Table 16.
Fig. 5
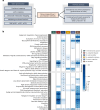
Fig. 5. Overview of the gene prioritization pipeline and results from the pathway enrichment analysis for the residual frailty factors.
a, Overview of the methods used to conduct gene prioritization and subsequent pathway analysis for the latent frailty factor GWAS results. b, Heatmaps of the results for the combined pathway enrichment analysis of the residual frailty factors (that is, factors 1–6). Top: the heatmap shows the results for the top 20 most enriched Gene Ontology pathway clusters. The displayed values represent the enrichment value for the most significant Gene Ontology term in each cluster (as named on the y axis). Bottom: the heatmap displays the results for the top 20 most significantly enriched disease pathways from the DisGeNET database. There were no significantly enriched pathways for factor 1 (limited social support) because only four genes (CTNND1, TMX2, MED19 and EGR3) were mapped to that latent factor. FDR correction was used to account for multiple testing; significant enrichment values are marked with an asterisk (that is, one-sided q < 0.05). GFR, growth factor receptor; mQTL, methylation QTL; sQTL, splicing QTL; VEGFA/R2, vascular endothelial growth factor A/receptor 2.
Fig. 6
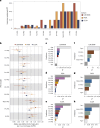
Fig. 6. Results from the PRS analyses of the latent frailty factors conducted in the LBC1936 (n = 1,005), PISA (n = 3,265) and ELSA (n = 7,181) cohorts.
a, Bar plot of the variance explained (R2) by each PRS that we estimated to predict the FI in each external cohort. b, Forest plot of the estimated odds ratios for frailty (measured by the FI) per s.d. of the PRS distribution for each latent frailty factor in each external cohort. Data are represented as odds ratios and their corresponding 95% confidence intervals (CIs) as the error bars. These values were calculated using linear regression models. We applied FDR correction to account for multiple testing and significant predictions (that is, two-sided q < 0.05) are depicted as filled circles, whereas nonsignificant predictions are depicted as empty circles. ce, Bar plots of the elastic net regression analyses ranking the contributions of the seven latent frailty factors in predicting frailty status in LBC1936 (c), PISA (d) and ELSA (e). Each model included all seven latent factor PRS as well as age, sex and ancestral PCs as covariates. fh, Bar plots of the elastic net regression analyses that ranked the performance of our multi-PRS (that is, combined latent frailty factor score) when modeled with the aggregate FI-PRS, the aggregate FP-PRS, and age, sex and ancestral PCs included as covariates in LBC1936 (f), PISA (g) and ELSA (h). All analyses represent standardized results.

References

    1. Fogg, C. et al. The dynamics of frailty development and progression in older adults in primary care in England (2006–2017): a retrospective cohort profile. BMC Geriatr.22, 30 (2022). - PMC - PubMed
    1. Kojima, G., Iliffe, S. & Walters, K. Frailty index as a predictor of mortality: a systematic review and meta-analysis. Age Ageing47, 193–200 (2018). - PubMed
    1. Park, C. M. et al. Frailty and hospitalization-associated disability after pneumonia: a prospective cohort study. BMC Geriatr.21, 111 (2021). - PMC - PubMed
    1. O’Caoimh, R. et al. Prevalence of frailty in 62 countries across the world: a systematic review and meta-analysis of population-level studies. Age Ageing50, 96–104 (2021). - PubMed
    1. Young, A. C. M., Glaser, K., Spector, T. D. & Steves, C. J. The identification of hereditary and environmental determinants of frailty in a cohort of UK twins. Twin Res. Hum. Genet.19, 600–609 (2016). - PubMed

LinkOut - more resources