. 2025 Aug 4;16(1):7165.
doi: 10.1038/s41467-025-62343-3.

Histone lactylation regulates DOCK4 to control heat nociception and supports Dynein-mediated Nav1.7 trafficking

Affiliations

Histone lactylation regulates DOCK4 to control heat nociception and supports Dynein-mediated Nav1.7 trafficking

Man-Xiu Xie et al. Nat Commun. .

Abstract

Heat nociception involves thermosensors like transient receptor potential channel V1 in dorsal root ganglion (DRG) neurons, but their loss only partially impairs heat sensing, suggesting other mechanisms. Autism frequently involves abnormal pain perception, but its mechanisms remain unclear. Here we show that dedicator of cytokinesis 4 (Dock4), an autism susceptibility gene, is decreased in DRG neurons across multiple pain models via histone H4K8 lactylation. DOCK4 deficiency in sensory neurons increases heat nociception in mice. Mechanistically, DOCK4 interacts with sodium channel Nav1.7 and mediates its trafficking from the membrane to the cytoplasm in DRG neurons. Acting an adaptor protein, DOCK4 binds the motor protein Dynein to form a Dynein/DOCK4/Nav1.7 complex, where Dynein provides the mechanical force for Nav1.7 trafficking. DOCK4 knockdown in sensory neurons also enhances heat nociception in male nonhuman primates. Thus, the Dynein/DOCK4/Nav1.7 complex represents a thermosensor-independent mechanism regulating heat nociception and provides insights into abnormal pain in autism.


Conflict of interest statement

Competing interests: The authors declare no competing interests.

Figures

Fig. 1
Fig. 1. DOCK4 is expressed in sensory neurons and decreases under conditions of pathological pain.
a To identify common mechanisms and targets for different types of pathological pain, we established four pain models. We then collected L4-L6 DRG tissues from mice with pathological pain for RNA-seq analysis. (Created in BioRender. https://BioRender.com/xs51blc). b The expression of the three genes Dock4, Afmid, and Rpl15-ps3 was simultaneously decreased in the L4-L6 DRGs tissue of mice across the SNL, CFA, PTX, and LLC models. n = 3 samples per group. c Compared with naïve mice, the fold decrease of Dock4, Afmid, and Rpl15-ps3 in the L4-L6 DRGs of mice after SNL, CFA, PTX, and LLC treatment. d–g The mRNA expression of Dock4 in L4-L6 DRG tissues of SNL (Day 7), CFA (Day 3), PTX (Day 7) and LLC (Day 14) mice. n = 3 samples per group in d; n = 4 samples per group in e, f and g. t4 = 5.643, P = 0.0049 in d; t6 = 5.52, P = 0.0015 in e; t6 = 3.451, P = 0.0136 in f; t6 = 3.22, P = 0.0181 in (g). h–k The DOCK4 protein expression in L4-L6 DRG tissues of SNL (Day 7), CFA (Day 3), PTX (Day 7) and LLC (Day 14) mice. n = 3 samples per group. t4 = 4.58, P = 0.0102 in h; t4 = 3.169, P = 0.0339 in i; t4 = 6.461, P = 0.003 in j; t4 = 5.52, P = 0.0053 in k. l The expression abundance of the DOCK4 protein in sciatic nerve (SN), L4-L6 DRGs, and L4-L6 dorsal root (DR) tissues of Dock4WT (Dock4flox/flox) and AvCreERT2; Dock4CKO mice. m The immunostaining and in situ hybridization showed that DOCK4 protein and corresponding mRNA were expressed in most L4 DRG neurons of mice. Compared to Dock4WT mice, the lack of DOCK4 in the DRG of AvCreERT2; Dock4CKO mice following tamoxifen injection indicates the high specificity of both the DOCK4 antibody and probe. Scale bar, 100 μm. n, o Double immunostaining of DOCK4 with IB4, CGRP and NF200 in the L4 DRG and sciatic nerve of mice. Scale bar, left 100 μm, right 25 μm. d–k Two-tailed Independent Student’s t test. *P < 0.05, **P < 0.01. Data are presented as mean ± SEM. Complete sample size and sex is provided in the Supplementary Data. Source data are provided as a Source Data file.
Fig. 2
Fig. 2. Histone lactylation mediates the decrease of DOCK4.
a–d The pan-lactylation (Pan Kla) levels in the DRG tissues of SNL, CFA, PTX, and LLC mice. e Changes in lactate levels in the DRG tissues of mice subjected to SNL, CFA, PTX, and LLC. n = 6 mice in control, PTX and LLC groups; n = 8 mice in SNL group; n = 7 mice in CFA group. F(4, 28) = 7.84, P = 0.011 in SNL vs. control, P = 0.0002 in CFA vs. control, P = 0.0436 in PTX vs. control, P = 0.0007 in LLC vs. control. f The schematic diagram of intrathecal (i.t.) injection of sodium lactate (NaLA) (Created in BioRender. https://BioRender.com/xs51blc). g, h The effect of intrathecal injection of sodium lactate (NaLA, 50 μM) on the expression of DOCK4 in DRG tissues. n = 3 samples per group. t4 = 4.096, P = 0.0149 in (g); t4 = 2.894, P = 0.0444 in (h). i The schematic diagram of intraperitoneal (i.p.) injection of oxamate (Created in BioRender. https://BioRender.com/xs51blc). j, k The effect of intraperitoneal injection of oxamate (300 mg/kg) on the expression of DOCK4 in DRG tissues. n = 3 samples per group. t4 = 7.543, P = 0.0017 in (j); t4 = 2.837, P = 0.047 in (k). l–o The effect of oxamate on the expression of Dock4 mRNA in DRG tissues of SNL, CFA, PTX, and LLC mice. n = 3 samples per group in l, m and o; n = 4 samples per group in (n). F(2, 6) = 12.34, P = 0.0097 in sham vs. SNL, P = 0.0156 in SNL vs. SNL + oxamate in l; F(2, 6) = 11.14, P = 0.0224 in saline vs. CFA, P = 0.0113 in CFA vs. CFA + oxamate in m; F(2, 9) = 8.226, P = 0.039 in vehicle vs. PTX, P = 0.0093 in PTX vs. PTX + oxamate in n; F(2, 6) = 15.54, P = 0.0116 in IC vs. LLC, P = 0.0048 in LLC vs. LLC + oxamate in o. p The change of H3K9la, H3K18la, H3K14la, H4K5la, H4K8la, H4K12la, and H4K16la level in DRG of mice after SNL treatment. n = 3-4 samples per group. t4 = 6.515, P = 0.0029 in H4K8la; t4 = 4.34, P = 0.0122 in H4K12la. q The change of H4K8la, H4K12la, and H4K16la level in DRG of mice after CFA treatment. n = 4 samples per group. t6 = 2.691, P = 0.036. r The change of H4K8la level in DRG of mice after PTX treatment. n = 4 mice per group. t6 = 2.75, P = 0.0333. s The change of H4K8la level in DRG of mice after LLC treatment. n = 3 samples per group. t4 = 3.071, P = 0.0372. t–w ChIP-qPCR was used to assess the impact of oxamate on the relative occupancy of H4K8la with the Dock4 promoter in the DRGs of mice subjected to SNL, CFA, PTX, and LLC. n = 3 per group. F(2, 6) = 9.186, P = 0.0334 in sham vs. SNL, P = 0.0175 in SNL vs. SNL + oxamate in (t); F(2, 6) = 9.492, P = 0.0214 in saline vs. CFA, P = 0.0219 in CFA vs. CFA + oxamate in (u); F(2, 6) = 13.41, P = 0.0089 in vehicle vs. PTX, P = 0.0111 in PTX vs. PTX + oxamate in (v); F(2, 6) = 9.727, P = 0.0125 in IC vs. LLC, P = 0.048 in LLC vs. LLC + oxamate in (w). x ChIP-qPCR was used to assess the impact of sodium lactate (NaLA) on the relative occupancy of H4K8la with the Dock4 promoter in the DRGs. n = 3 per group. t4 = 4.164, P = 0.0141. y The schematic shows that pathological pain upregulates lactic acid in the DRG, leading to increased lactylation of histone H4K8, which inhibits Dock4 gene transcription (Created in BioRender. https://BioRender.com/xs51blc). g, h, j, k, p, q, r, s, x, Two-tailed Independent Student’s t test; e, l–o, t–w, One-way ANOVA followed by Tukey’s multiple comparisons test. *P < 0.05, **P < 0.01, ***P < 0.001, n.s. means not significant. Data are presented as mean ± SEM. Complete sample size and sex is provided in the Supplementary Data. Source data are provided as a Source Data file.
Fig. 3
Fig. 3. Loss of DOCK4 in sensory neurons enhances heat nociception.
a Diagram illustrating the injection of non-targeting (NT)-siRNA or DOCK4-siRNA into the sciatic nerve of mice, followed by behavioral and immunostaining tests conducted 2 days post-injection. b The behaviors were tested in NT-siRNA or DOCK4-siRNA injected mice by Hargreaves experiment. n = 16 mice/group. t30 = 4.411, P = 0.0001. c Short-term conditional place aversion (CPA) assays pairing in dark chamber with heat (cutoff 8 s), punctate (1.0 g) and dynamic stimuli were performed in NT-siRNA and DOCK4-siRNA injected mice. d The short-term CPA scores induced by Hargreaves stimuli was assessed in NT-siRNA and DOCK4-siRNA injected mice. n = 7 mice/group. t12 = 2.213, P = 0.047. e Diagram illustrating the intrathecal injection of AAV-hSyn-GFP or AAV-hSyn-Cre-GFP into Dock4flox/flox mice, followed by behavioral and molecular biology tests conducted 21 days post-injection. f–h The behaviors were tested in AAV-GFP and AAV-Cre injected Dock4flox/flox mice by Hargreaves, tail-flick, and hot plate experiments. n = 6 mice/group. t10 = 5.439, P = 0.0003 in (f). t10 = 3.303, P = 0.008 in 46 °C; t10 = 3.053, P = 0.0122 in 48 °C; t10 = 6.82, P = 0.000046 in 50°C in (g). t10 = 4.76, P = 0.0008 in 50 °C; t10 = 3.952, P = 0.0027 in 52 °C; t10 = 3.379, P = 0.007 in 55°C in (h). i The CPA scores induced by Hargreaves training was assessed in AAV-GFP and AAV-Cre injected Dock4flox/flox mice. n = 6 mice/group. t10 = 8.817, P = 0.000005. j Diagram depicting the intraperitoneal injection (i.p.) of tamoxifen (TAM) into Dock4WT (Dock4flox/flox) and AvCreERT2; Dock4CKO mice, followed by subsequent behavioral and molecular biology tests. k–r The behaviors were tested in Dock4WT and AvCreERT2; Dock4CKO mice by Hargreaves, tail-flick, and hot plate experiments with or without TAM injection. n = 8 mice in Dock4WT group, n = 10 mice in AvCreERT2; Dock4CKO group. t18 = 8.834, P = 0.00000006 in (k); t18 = 7.735, P = 0.0000008 in (l); t18 = 4.432, P = 0.0003 in (m); t18 = 4.089, P = 0.0007 in (n); t18 = 3.913, P = 0.001 in (o); t18 = 4.486, P = 0.0003 in (p); t18 = 5.998, P = 0.000011 in (q); t18 = 4.628, P = 0.0002 in (r). s The CPA scores induced by Hargreaves training was assessed in with or without TAM injected Dock4WT and AvCreERT2; Dock4CKO mice. n = 8 mice in Dock4WT group, n = 10 mice in AvCreERT2; Dock4CKO group. t18 = 3.745, P = 0.0015. t-v The behaviors were tested in Dock4WT and Trpv1-Cre; Dock4CKO mice by Hargreaves, tail-flick, and hot plate experiments. n = 13 mice in Dock4WT group, n = 12 mice in Trpv1-Cre; Dock4CKO group. t23 = 3.088, P = 0.0052 in t. t23 = 2.377, P = 0.0261 in 46 °C; t23 = 7.244, P = 0.0000002 in 48 °C; t23 = 4.257, P = 0.0003 in 50 °C; t23 = 2.875, P = 0.0086 in 52 °C in u. t23 = 4.481, P = 0.0002 in 50 °C; t23 = 2.171, P = 0.0405 in 52 °C; t23 = 2.287, P = 0.0318 in 55 °C in v. b, d, f–i, k–v, Two-tailed Independent Student’s t test. *P < 0.05, **P < 0.01, ***P < 0.001, n.s. means not significant. Data are presented as mean ± SEM. Complete sample size and sex is provided in the Supplementary Data. Source data are provided as a Source Data file.
Fig. 4
Fig. 4. Overexpression of DOCK4 decreases heat nociception and alleviates pathological heat hyperalgesia.
a Diagram illustrating the intrathecal injection of CAS9-Easy-SAM lentivirus (LV) vector into mice, followed by behavioral and molecular biology tests conducted 14 days post-injection (Created in BioRender. https://BioRender.com/xs51blc). bd The impact of DOCK4 overexpression on behavioral responses to Hargreaves, tail-flick, and hot plate experiments. n = 10 mice in control, n = 8 mice in DOCK4-over in b and d; n = 9 mice in control, n = 12 mice in DOCK4-over in c. t16 = 3.662, P = 0.0021 in (b). t19 = 2.819, P = 0.011 in 46 °C; t19 = 2.406, P = 0.0256 in 48 °C; t19 = 5.578, P = 0.000022 in 50 °C; t19 = 3.683, P = 0.0016 in 52°C in (c). t16 = 2.612, P = 0.0189 in 50 °C; t16 = 3.913, P = 0.0012 in 52 °C; t16 = 2.49, P = 0.0242 in 55°C in (d). e Left: the absolute time spent in the dark A chamber before (pre) versus after (post) Hargreaves pairing in control and DOCK4-overexpressed mice. Right: The CPA scores induced by Hargreaves training was assessed in control and DOCK4-overexpressed mice. n = 6 mice per group. t10 = 4.026, P = 0.0024 in left; t10 = 2.434, P = 0.0352 in right. f-i The impact of DOCK4 overexpression on the pathological thermal hyperalgesia induced by CFA and SNL (Created in BioRender. https://BioRender.com/xs51blc). n = 6 mice/group. F(1, 40) = 63.57, P = 0.049 in 0 d, P = 0.0103 in 1 d, P = 0.000019 in 3 d, P = 0.000082 in 5 d in g; F(1, 50) = 170.8, P = 0.0015 in 0 d, P = 0.000007 in 4 d, P = 0.000003 in 7 d, P = 0.00000007 in 10 d, P = 0.000000007 in 14 d in i. j, k The impact of DOCK4 overexpression on the thermal hyperalgesia induced by CFA and SNL (normalized to 0 day). n = 6 mice/group. F(1, 40) = 22.99, P = 0.0016 in 3 d, P = 0.0051 in 5 d in j; F(1, 50) = 39.9, P = 0.0219 in 4 d, P = 0.028 in 7 d, P = 0.0015 in 10 d; P = 0.0003 in 14 d in k. l-q The impact of DOCK4 overexpression on the pathological thermal hyperalgesia induced by PTX and LLC (Created in BioRender. https://BioRender.com/xs51blc). n = 8 mice in control, n = 9 mice in DOCK4-over in m and n; n = 9 mice in control, n = 10 mice in DOCK4-over in p and q. F(1, 60) = 183.5, P = 0.000041 in 0 d, P = 0.000000002 in 5 d, P = 0.0000000004 in 7 d, P = 0.00000001 in 14 d in m; F(1, 60) = 27.76, P = 0.0029 in 5 d, P = 0.0005 in 7 d, P = 0.0231 in 14 d in n; F(1, 68) = 94.76, P = 0.0048 in 0 d, P = 0.0001 in 7 d, P = 0.00001 in 10 d, P = 0.00000005 in 14 d in p; F(1, 68) = 18.08, P = 0.0325 in 10 d, P = 0.0005 in 14 d in q. r-t Schematic diagram for the in vivo calcium imaging of sensory neurons and the representative images of GCaMP6 fluorescence as a measure of intracellular calcium following stimulation to the hindpaw (Created in BioRender. https://BioRender.com/xs51blc). Scale bar, 100 μm. u In comparison to Dock4WT mice, small, medium, and large-sized DRG neurons in AvCreERT2; Dock4CKO mice exhibited no significant changes in their responses to brush stimulation ( < 500 μm2 Dock4WT, n = 33 cells; AvCreERT2; Dock4CKO, n = 35 cells; 500-1000 μm2 Dock4WT, n = 28 cells; AvCreERT2; Dock4CKO, n = 25 cells; >1000 μm2 Dock4WT, n = 11 cells; AvCreERT2; Dock4CKO, n = 12 cells). v Compared to Dock4WT mice, all sized DRG neurons in AvCreERT2; Dock4CKO mice showed no significant changes in response to pinch stimulation ( < 500 μm2 Dock4WT, n = 105 cells; AvCreERT2; Dock4CKO, n = 116 cells; 500-1,000 μm2 Dock4WT, n = 52 cells; AvCreERT2; Dock4CKO, n = 61 cells; >1,000 μm2 Dock4WT, n = 13 cells; AvCreERT2; Dock4CKO, n = 15 cells). w In comparison to Dock4WT, small and medium-sized DRG neurons in AvCreERT2; Dock4CKO mice showed significantly increased responses to heat stimulation ( < 500 μm2 Dock4WT, n = 61 cells; AvCreERT2; Dock4CKO, n = 132 cells; 500-1,000 μm2 Dock4WT, n = 9 cells; AvCreERT2; Dock4CKO, n = 25 cells; >1,000 μm2 Dock4WT, n = 3 cells; AvCreERT2; Dock4CKO, n = 5 cells). t191 = 3.535, P = 0.0005 in <500 μm2; t32 = 3.415, P = 0.0018 in 500-1,000 μm2. x Compared to Dock4WT mice, all sized DRG neurons in AvCreERT2; Dock4CKO mice showed no significant alters in response to capsaicin stimulation ( < 500 μm2 Dock4WT, n = 43 cells; AvCreERT2; Dock4CKO, n = 51 cells; 500-1,000 μm2 Dock4WT, n = 2 cells; AvCreERT2; Dock4CKO, n = 5 cells; >1,000 μm2 AvCreERT2; Dock4CKO, n = 2 cells). b-e, u-x, Two-tailed Independent Student’s t test; g, i–k, m, n, p, q, Two-way ANOVA followed by Bonferroni’s multiple comparisons test. *P < 0.05, **P < 0.01, ***P < 0.001, n.s. means not significant. Data are presented as mean ± SEM. Complete sample size and sex is provided in the Supplementary Data. Source data are provided as a Source Data file.
Fig. 5
Fig. 5. DOCK4 interacts with Nav1.7 and mediates the trafficking of Nav1.7 from the membrane to the cytoplasm in DRG neurons.
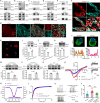
a–d DRG lysates were immunoprecipitated with DOCK4 antibody and immunoblotted with Nav1.6, TRPV1, Nav1.7, TRPA1, Nav1.8, Nav1.9, TRPM3 and DOCK4 antibody as indicated. This experiment was repeated three times. e DRG lysates were immunoprecipitated with Nav1.7 antibody and immunoblotted with DOCK4 and Nav1.7 antibody as indicated. This experiment was repeated three times. f Double immunostaining of DOCK4 and Nav1.7 in DRGs. Scale bar, 100 μm. g High-resolution images showing the colocalization of DOCK4 and Nav1.7 in DRG neurons. Scale bar, 10 μm. h Proximity ligation assay (PLA) showed positive signals of DOCK4/Nav1.7 interaction in cultured DRG neurons (5 images from two repeats). Scale bar, 20 μm. i–k Expression of Nav1.7 in the membrane, cytoplasmic, and total lysate from DRG neurons of Dock4WT and AvCreERT2; Dock4CKO mice. n = 3 samples per group. t4 = 4.187, P = 0.0138 in i; t4 = 16.44, P = 0.00008 in (j). l Representative images depicting Nav1.7 membrane and cytoplasmic staining in DRG neurons from AAV-GFP and AAV-Cre injected Dock4flox/flox mice are presented. Profile plots were utilized to delineate membrane staining. Subsequently, a ratio of membrane to cytoplasm was computed, with cells exhibiting a ratio exceeding 1.5 times defined as Nav1.7 membrane positive. Scale bar, 10 μm. m–o Expression of Nav1.7 in the membrane, cytoplasmic, and total lysate from DRG neurons of control and DOCK4 overexpressed mice. n = 3 samples per group. t4 = 6.05, P = 0.0038 in m; t4 = 4.389, P = 0.0118 in (n). p The I-V curves showed the peak Nav1.7 currents recorded under different potentials in primary cultured DRG neurons from Dock4WT and AvCreERT2; Dock4CKO mice. n = 6 neurons per group. F(1, 370) = 92.99, P = 8.87×10⁻²⁰. q, r Impacts of DOCK4 deletion on the activation, inactivation, and recovery of Nav1.7 channels in DRG neurons. n = 6-8 neurons per group. s, t The number of action potentials in DRG neurons was increased in the AvCreERT2; Dock4CKO mice compared to the Dock4WT mice, and this increase could be reversed by the Nav1.7 blocker ProTxII. n = 8 neurons per group. F(2, 21) = 12.76, P = 0.0005 in AvCreERT2; Dock4CKO vs. Dock4WT, P = 0.0012 in AvCreERT2; Dock4CKO vs. AvCreERT2; Dock4CKO + ProTxII. i–k, m–o, Two-tailed Independent Student’s t test; t, One-way ANOVA followed by Tukey’s multiple comparisons test; p–r, Two-way ANOVA followed by Bonferroni’s multiple comparisons test. *P < 0.05, **P < 0.01, ***P < 0.001, n.s. means not significant. Data are presented as mean ± SEM. Complete sample size and sex is provided in the Supplementary Data. Source data are provided as a Source Data file.
Fig. 6
Fig. 6. Disrupting DOCK4/Nav1.7 interaction enhances heat nociception, and heat stimulation maintains the membrane localization of Nav1.7.
a Schematic diagram of the full-length C-terminus of Nav1.7 (Nav1.7CT) and various truncated fragment variants. b A GST pull-down assay with two purified proteins, GST-flag-Nav1.7CT and DOCK4, shows the direct interaction between DOCK4 and Nav1.7. The major interaction site is F2 (1825-1899 aa) of Nav1.7CT. This experiment was repeated three times. c Schematic diagram of the DOCK4 full-length and various truncated fragment variants. d A GST pull-down assay reveals the interaction between DOCK4 and Nav1.7, with the interaction site identified as the DC (1311-1966 aa) region of DOCK4. This experiment was repeated three times. e Nav1.7CT-F2 fragment (1825-1899 aa) AAV overexpression vector construction schematic. f The expression of GFP in the DRG neurons of AAV-injected mice indicates successful Nav1.7CT-F2 overexpression. Scale bar, 100 μm. g, h The effect of Nav1.7CT-F2 overexpression on the interaction between DOCK4 and Nav1.7. n = 3 repeats per group. t4 = 5.18, P = 0.0066. i–k The impact of Nav1.7CT-F2 overexpression on behavioral responses to Hargreaves, tail-flick, and hot plate tests. n = 6 mice per group. t10 = 3.296, P = 0.0081 in (i). t10 = 3.155, P = 0.0103 in 48 °C; t10 = 4.859, P = 0.0007 in 50 °C; t10 = 4.03, P = 0.0024 in 52°C in (j). t10 = 4.551, P = 0.0011 in 50 °C; t10 = 2.611, P = 0.026 in 52 °C; t10 = 4.679, P = 0.0009 in 55°C in k. l The CPA scores induced by Hargreaves training was assessed in control and Nav1.7CT-F2 overexpressed mice. n = 6 mice per group. t10 = 5.667, P = 0.0002. m The impact of Nav1.7CT-F2 overexpression on behavioral responses to intense mechanical pinprick tests. n = 6 mice per group. n The influence of Nav1.7CT-F2 overexpression on the distribution of Nav1.7 in the membrane and cytoplasm of cultured DRG neurons. Profile plots were utilized to delineate membrane staining. Scale bar, 10 μm. o The impact of Nav1.7CT-F2 overexpression on the peak Nav1.7 currents in cultured DRG neurons. n = 7 neurons in control group, n = 6 neurons in Nav1.7CT-F2 group. F(1, 407) = 74.63, P = 1.31 × 10⁻¹⁶. p The diagram illustrates the experimental procedure. The hindpaws of the mice were immersed in a 43 °C water bath for 30 seconds, after which the mice were placed at RT for 5, 10, 20, or 40 minutes. Behavioral and biochemical experiments were then conducted (Created in BioRender. https://BioRender.com/xs51blc). q The impact of heat stimulation on the behaviors of mice response to the Hargreaves. n = 8 mice in RT group, n = 10 mice in 43 °C group. F(1, 80) = 10.88, P = 0.0072 in 5 min, P = 0.0004 in 10 min. r The impact of heat stimulation on the interaction between DOCK4 and Nav1.7 in DRG lysates of mice. s The impact of heat stimulation on the membrane expression of Nav1.7 in DRGs of mice. n = 3 samples per group. F(2, 6) = 23.14, P = 0.0021 in RT vs. 10 min, P = 0.0032 in 10 min vs. 40 min. t, u The impact of heat stimulation on the total expression of Nav1.7 and DOCK4 in DRGs of mice. n = 3 samples per group. v The diagram outlines the experimental procedure. Isolated DRG neurons were immersed in a 43 °C water bath for 30 seconds and then placed at RT for either 10 or 40 minutes. Subsequently, the neurons were lysed to assess the membrane abundance of Nav1.7 (Created in BioRender. https://BioRender.com/xs51blc). w Nav1.7 membrane expression in isolated DRG neurons was evaluated at different time points after direct heat stimulation. n = 4 repeats. F(2, 9) = 25.61, P = 0.0002 in RT vs. 10 min, P = 0.0021 in 10 min vs. 40 min. x, y The effect of DOCK4 deleted in DRG neurons on the behaviors of mice response to the Hargreaves after heat stimulation. n = 8 mice in AAV-GFP group, n = 11 mice in AAV-Cre group, n = 9 mice in Dock4WT group, n = 10 mice in AvCreERT2; Dock4CKO group. F(4, 68) = 19.05, P = 0.0115 in 5 min, P = 0.00000002 in 10 min, P = 0.0007 in 20 min in x; F(4, 68) = 13.79, P = 0.0002 in 5 min, P = 0.00000005 in 10 min, P = 0.0085 in 20 min in y. h–m, t, u, Two-tailed Independent Student’s t test; s, w, One-way ANOVA followed by Tukey’s multiple comparisons test; o, q, x, y, Two-way ANOVA followed by Bonferroni’s multiple comparisons test. *P < 0.05, **P < 0.01, ***P < 0.001, n.s. means not significant. Data are presented as mean ± SEM. Complete sample size and sex is provided in the Supplementary Data. Source data are provided as a Source Data file.
Fig. 7
Fig. 7. Dynein participates in DOCK4-modulated trafficking of Nav1.7.
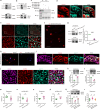
a DRG lysates were immunoprecipitated with DOCK4 antibody and immunoblotted with Dynein and DOCK4 antibody as indicated. This experiment was repeated three times. b DRG lysates were immunoprecipitated with Dynein antibody and immunoblotted with DOCK4 and Dynein antibody as indicated. This experiment was repeated three times. c The Co-IP assay reveals the interaction between DOCK4 and Dynein, with the interaction site identified as the DN (1-655 aa) region of DOCK4. This experiment was repeated three times. d The colocalization of DOCK4 and Dynein in DRG neurons of mice. The box represents magnification. Scale bar, 100 μm. e High-resolution images showing the colocalization of DOCK4 and Dynein in DRG neurons of mice. Scale bar, 10 μm. f Proximity ligation assay (PLA) showed positive signals of DOCK4/Dynein interaction in cultured DRG neurons (6 images from two repeats). Scale bar, 50 μm. g The interaction level between Dynein and Nav1.7 was examined by co-IP in Dock4WT and AvCreERT2; Dock4CKO mouse DRG lysates. DRG lysates were immunoprecipitated with Dynein antibody and immunoblotted with Nav1.7 and Dynein antibody as indicated. This experiment was repeated three times. t4 = 17.34, P = 0.000065. h Proximity ligation assay (PLA) shows positive signals of Dynein/Nav1.7 interaction in cultured DRG neurons of Dock4WT mice, and signals was loss in cultured DRG neurons of AvCreERT2; Dock4CKO mice (7 images from two repeats). Scale bar, 50 μm. i Immunofluorescence triple staining demonstrates the co-localization of Dynein, DOCK4, and Nav1.7 in DRG neurons of mice. Scale bar, 100 μm. j High-resolution images show the colocalization of Dynein, DOCK4, and Nav1.7 in DRG neurons of mice. Scale bar, 2 μm. k Changes in membrane expression of Nav1.7 following Dynein knockdown in the DRGs. n = 3 samples per group. t4 = 7.381, P = 0.0018. l Changes in membrane expression of Nav1.7 following Dynein overexpression in the DRGs. n = 3 samples per group. t4 = 6.923, P = 0.0023. m–p The effects of Dynein knockdown and overexpression on mouse Hargreaves and tail-flick behaviors. n = 6 mice per group in m and o, n = 5 mice per group in (n and p). t10 = 2.83, P = 0.0179 in m; t8 = 3.079, P = 0.0151 in n; t10 = 3.054, P = 0.0122 in o; t8 = 4.236, P = 0.0029 in (p). q Dynein knockdown reversed the effect of DOCK4 overexpression on membrane expression of Nav1.7 in the DRGs. n = 3 samples per group. F(2, 6) = 18.28, P = 0.0034 in control vs. DOCK4-over, P = 0.0071 in DOCK4-over vs. DOCK4-over + Dynein-shRNA. r Dynein knockdown reversed the effect of DOCK4 overexpression on mouse Hargreaves behavior. n = 6 mice per group. F(2, 15) = 6.149, P = 0.0203 in control vs. DOCK4-over, P = 0.0226 in DOCK4-over vs. DOCK4-over + Dynein-shRNA. g, k–p, Two-tailed Independent Student’s t test; q, r, One-way ANOVA followed by Tukey’s multiple comparisons test. *P < 0.05, **P < 0.01, ***P < 0.001. Data are presented as mean ± SEM. Complete sample size and sex is provided in the Supplementary Data. Source data are provided as a Source Data file.
Fig. 8
Fig. 8. Interfering with DOCK4 enhances heat nociception in nonhuman primates and knockdown DOCK4 increases Nav1.7 currents in human DRG neurons.
a High-resolution images show the colocalization of Dynein, DOCK4, and Nav1.7 in DRG neurons of a monkey. Scale bar, 10 μm. b–d Heat sensitivity changes in monkeys after intrathecal injection of DOCK4-siRNA (20 nmol) in tail-flick and hot plate tests. n = 4 monkeys per group. F(1, 24) = 21.87, P = 0.0000001 in (b); F(1, 24) = 2.807, P = 0.0068 in (c); F(1, 24) = 1.607, P = 0.0134 in (d). e Immunocytochemistry showing knockdown of DOCK4 expression by DOCK4-siRNA treatment (50 nM, 48 h) in cultured monkey DRG neurons. Scale bar, 100 μm. f Intensity of DOCK4-immunoreactivity in monkey DRG neurons after DOCK4-siRNA and nontargeting (NT)-siRNA treatment. n = 33 neurons in NT-siRNA, n = 32 neurons in DOCK4-siRNA. t63 = 6.622, P = 0.000000009. g The influence of DOCK4 knockdown on the distribution of Nav1.7 in the membrane and cytoplasm of cultured monkey DRG neurons. Profile plots were utilized to delineate membrane staining. Scale bar, 25 μm. h The impact of DOCK4 knockdown on the peak Nav1.7 currents in cultured monkey DRG neurons. n = 8 neurons in NT-siRNA, n = 9 neurons in DOCK4-siRNA. F(1, 555) = 116.4, P = 9.19×10⁻²⁵. i The expression of DOCK4 protein in human DRG sections. Scale bar, left: 500 μm, right: 200 μm. j The size frequency distribution of DOCK4-positive (DOCK4+) and total neurons was examined in human DRG sections. A total of 2706 neurons from three human DRGs were analyzed. k The co-localization of Dynein, DOCK4, and Nav1.7 in human DRG neurons. Scale bar, 100 μm. l High-resolution images show the colocalization of Dynein, DOCK4, and Nav1.7 in DRG neurons of human. Scale bar, 1 μm. m Proximity ligation assay (PLA) shows positive signals of DOCK4/Nav1.7 interaction in cultured human DRG neurons (5 images from two repeats). Scale bar, 100 μm. n Proximity ligation assay (PLA) shows positive signals of DOCK4/Dynein interaction in cultured human DRG neurons (6 images from two repeats). Scale bar, 100 μm. o Proximity ligation assay (PLA) shows positive signals of Dynein/Nav1.7 interaction in cultured human DRG neurons with NT-siRNA treatment, and signals was loss in cultured human DRG neurons with DOCK4-siRNA treatment (6 images from two repeats). Scale bar, 100 μm. p The influence of DOCK4 knockdown on the distribution of Nav1.7 in the membrane and cytoplasm of cultured human DRG neurons. Profile plots were utilized to delineate membrane staining. Scale bar, 25 μm. q The impact of DOCK4 knockdown on the peak Nav1.7 currents in cultured human DRG neurons. n = 9 neurons in NT-siRNA, n = 8 neurons in DOCK4-siRNA. F(1, 620) = 69.65, P = 4.61 × 10⁻¹⁶. r The model shows that DOCK4 acts as an adaptor, helping assemble the Nav1.7/DOCK4/Dynein complex to traffic Nav1.7 from the membrane to the cytoplasm in DRG neurons, affecting thermal pain perception. Loss of DOCK4 disrupts this process, increasing Nav1.7 membrane expression and causing heat hyperalgesia. f, Two-tailed Independent Student’s t test; b–d, h, q, Two-way ANOVA followed by Bonferroni’s multiple comparisons test. *P < 0.05, **P < 0.01, ***P < 0.001, n.s. means not significant. Data are presented as mean ± SEM. Complete sample size and sex is provided in the Supplementary Data. Source data are provided as a Source Data file.

References

    1. Sharma, S. R., Gonda, X. & Tarazi, F. I. Autism spectrum disorder: Classification, diagnosis and therapy. Pharm. Ther.190, 91–104 (2018). - PubMed
    1. Lord, C., Cook, E. H., Leventhal, B. L. & Amaral, D. G. Autism spectrum disorders. Neuron28, 355–363 (2000). - PubMed
    1. Buch, A. M. et al. Molecular and network-level mechanisms explaining individual differences in autism spectrum disorder. Nat. Neurosci.26, 650–663 (2023). - PMC - PubMed
    1. Robertson, C. E. & Baron-Cohen, S. Sensory perception in autism. Nat. Rev. Neurosci.18, 671–684 (2017). - PubMed
    1. Whitney, D. G. & Shapiro, D. N. National prevalence of pain among children and adolescents with autism spectrum disorders. JAMA Pediatr.173, 1203–1205 (2019). - PMC - PubMed

LinkOut - more resources