. 2025 Aug 4;26(1):205.
doi: 10.1186/s12859-025-06224-y.

GenomicLayers: sequence-based simulation of epi-genomes

Affiliations

GenomicLayers: sequence-based simulation of epi-genomes

Dave T Gerrard. BMC Bioinformatics. .

Abstract

Background: Cellular development and differentiation in Eukaryotes depends upon sequential gene regulatory decisions that allow a single genome to encode many hundreds of distinct cellular phenotypes. Decisions are stored in the regulatory state of each cell, an important part of which is the epi-genome-the collection of proteins, RNA and their specific associations with the genome. Additionally, further cellular responses are, in part, determined by this regulatory state. To date, models of regulatory state have failed to include the contingency of incoming regulatory signals on the current epi-genetic state and none have done so at the whole-genome level.

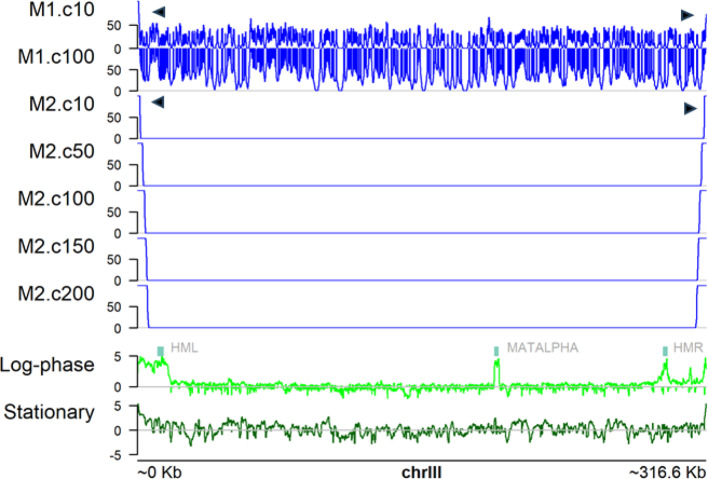
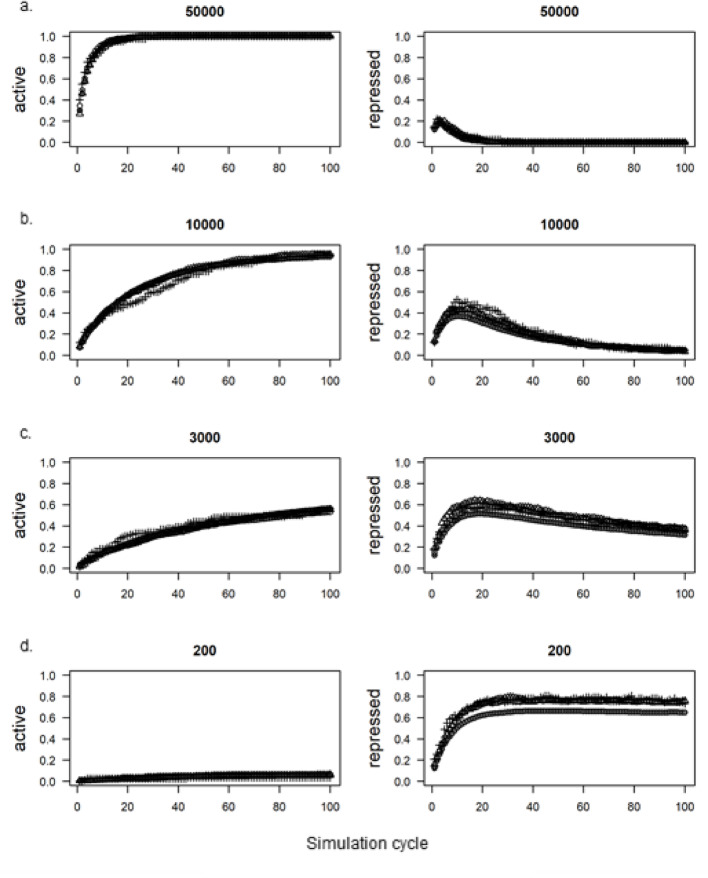
Results: Here we introduce GenomicLayers, a new R package to run rules-based simulations of epigenetic state changes genome-wide in Eukaryotes. Simulations model the accumulation of changes to genome-wide layers by user-specified binding factors. As a first exemplar, we show two versions of a simple model of the recruitment and spreading of epigenetic marks near telomeres in the yeast Saccharomyces cerevisiae. By combining the output from 100 runs of the simulation, we generate whole genome predictions of epigenetic state at 1 bp resolution. The example yeast models are included within a 'vignette' with the GenomicLayers package, which is available at https://github.com/davetgerrard/GenomicLayers . To demonstrate the use of GenomicLayers on the full human reference genome (hg38), we show the results from parameter refinement on a simplistic model of the action of pluripotency factors against a self-spreading repressor seeded at CpG islands. The human genome model is included in supplementary information as an R script.

Conclusions: GenomicLayers enables scientists working on diverse eukaryotic organisms to test models of gene regulation in silico. Applications include epigenetic silencing, activation by combinatorial binding of transcription factors and the sink effects caused by down-regulation of components of epigenetic regulators. The software is intended to be used to parameterise, refine and combine models and thereby capitalise on data from the thousands of studies of Eukaryotic epigenomes.

Keywords: Development; Epigenome; Genome; R; Simulation.


Conflict of interest statement

Declarations. Ethics approval and consent to participate: Not applicable. Consent for publication: Not applicable. Competing interests: The authors declare that they have no competing interests.

Figures

Fig. 1
Fig. 1
Core components of the GenomicLayers package. a Each simulation requires one ‘layerSet’ comprising a genome sequence as a BSgenome object and one or more layers as GRanges objects. The GRanges ‘layers’ are modified during the simulation and can be arbitrarily named. b One or more ‘bindingFactors’ each contain a ‘profile’ to match with combinations of layer states and/or the genome sequence. Sequence matches can be represented either as consensus sequences (using IUPAC codes), as position weight matrices (shown here as a seqLogo), or as regular expressions. The profile shown here only fully matches (both sequence and layers) at the position in a) shown by the red line (e.g. a sequence match AND LAYER.1 = present AND LAYER.3 = absent; LAYER.2 is ignored). Once a set of matches have been selected, the ‘mods’ of a binding factor dictate changes to the layerSet at that position (e.g. LAYER.2 set to absent AND LAYER.3 set to present). The extent of the modifications is determined by the statewidth parameter, which is independent of the width of the matching pattern. c A simulation comprises one or more cycles during which one or more bindingFactors are matched to the current state of the layerSet. The number of modifications performed by each bindingFactor each cycle is limited by a vector of ‘abundance’ values, which may be kept constant or varied between cycles. The layerSet state after modification becomes the starting state for the next cycle (green arrows) or can be measured against validation data (red arrow)
Fig. 2
Fig. 2
Output of whole genome Sir3 recruitment and spreading models M1 and M2 on Saccharomyces cerevisiae chromosome III (SacCer3: chrIII). Output from 100 replicated simulations were stored every 10 cycles (e.g. M2.c50 = Model 2, cycle 50). The outputs were summed using the function coverage() (GenomicRanges package) representing the number of simulations in which each base of the chromosome was marked by Sir3p. Note the high frequency of early Sir3p recruitment at the very tips of the telomeres in both models (denoted by filled arrowheads). Model 1, which allows recruitment of Sir3p from monomeric Rap1 binding, generates Sir3p binding all across the chromosome. Model 2 requires two adjacent Rap1 sites to seed Sir3p binding and has fewer seed sites from which Sir3p binding spreads out along the chromosome. The bottom two plots show Sir3p binding signal for Log-phase and stationary phase samples (light and dark green, respectively) measured using chromatin immunoprecipitation on a genome-wide tiling array (ChIP-chip) [34]. ‘MATALPHA’ marks the mating type-locus, which is repressed by Sir3p binding in the log-phase sample. Plot generated using plotSignal function (plotGardener package [17])
Fig. 3
Fig. 3
Proportion of Transcription Start Sites (TSS) covered by ‘active’ (left) or ‘repressed’ (right) states during 100 successive simulation cycles. Sub-plots a-d represent separate simulations using decreasing values of the shared statewidth parameter (shown above each plot). The symbols represent proportions from the three gene lists extracted from Tanaka et al. [33]: Open circles: Type I,Crosses: Type II; Open triangles: Type III. Filled grey circles: All other genes

References

    1. Atlasi Y, Stunnenberg HG. The interplay of epigenetic marks during stem cell differentiation and development. Nat Rev Genet. 2017;18(11):643–58. 10.1038/nrg.2017.57. - PubMed
    1. Biddle JW, Nguyen M, Gunawardena J. Negative reciprocity, not ordered assembly, underlies the interaction of Sox2 and Oct4 on DNA. Edited by Naama Barkai. Elife. 2019;8:e41017. 10.7554/eLife.41017. - PMC - PubMed
    1. Brown EJ, Nguyen AH, Bachtrog D. The Drosophila Y chromosome affects heterochromatin integrity genome-wide. Mol Biol Evol. 2020;37(10):2808–24. 10.1093/molbev/msaa082. - PMC - PubMed
    1. Chen J, Zhang Z, Li Li, Chen B-C, Revyakin A, Hajj B, Legant W, et al. Single-molecule dynamics of enhanceosome assembly in embryonic stem cells. Cell. 2014;156(6):1274–85. 10.1016/j.cell.2014.01.062. - PMC - PubMed
    1. Chung N, Bogliotti YS, Ding W, Vilarino M, Takahashi K, Chitwood JL, Schultz RM, Ross PJ. Active H3K27me3 demethylation by KDM6B is required for normal development of bovine preimplantation embryos. Epigenetics. 2017;12(12):1048–56. 10.1080/15592294.2017.1403693. - PMC - PubMed

LinkOut - more resources