

Predictive value of the combined triglyceride-glucose and frailty index for cardiovascular disease and stroke in two prospective cohorts
- PMID: 40759963
- PMCID: PMC12323107
- DOI: 10.1186/s12933-025-02880-9
Predictive value of the combined triglyceride-glucose and frailty index for cardiovascular disease and stroke in two prospective cohorts
Abstract
Background: The triglyceride-glucose (TyG) index is a validated surrogate for insulin resistance, while frailty reflects cumulative physiological decline. The combined impact of TyG-Frailty Index (TyGFI) has not been adequately explored. This study aimed to investigate the association between TyGFI and the risk of cardiovascular disease (CVD) and stroke.
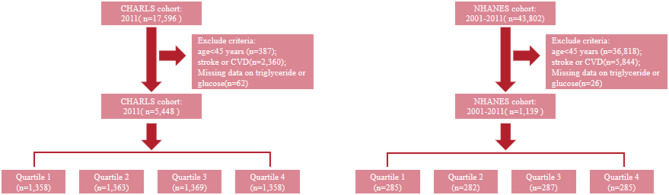
Methods: A total of 5448 participants from the China Health and Retirement Longitudinal Study (CHARLS) and 1139 participants from the U.S. National Health and Nutrition Examination Survey (NHANES) were included. Multivariable logistic regression models were used to estimate associations with CVD and stroke, adjusting for demographic, clinical, and lifestyle covariates. Restricted cubic spline (RCS) and subgroup analyses were employed to examine dose-response relationships and interaction effects.
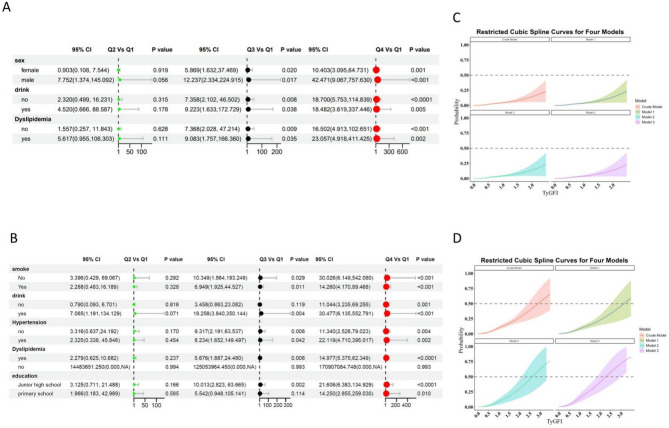
Results: Higher TyGFI levels were associated with older age, adverse metabolic parameters, and increased prevalence of hypertension, diabetes, and dyslipidemia. In fully adjusted models, the highest TyGFI quartile was significantly associated with increased risks of CVD (CHARLS: OR 15.09, 95% CI 9.65-23.60; NHANES: OR 4.98, 95% CI 2.04-12.19) and stroke (CHARLS: OR 21.12, 95% CI 6.44-69.23; NHANES: OR 12.98, 95% CI 2.58-65.17), with consistent dose-response trends confirmed by RCS analyses. Subgroup analyses further demonstrated the robustness of these associations across diverse demographic and clinical strata.
Conclusions: TyGFI is a strong and independent predictor of CVD and stroke in two nationally representative cohorts. By integrating metabolic and functional risk dimensions, TyGFI provides a more comprehensive risk stratification tool, with significant implications for early identification and prevention of cardiovascular events in aging populations.
Keywords: Cardiovascular disease; Frailty index; Population-based cohort; Stroke; Triglyceride-glucose index.
© 2025. The Author(s).
Conflict of interest statement
Declarations. Ethics approval and consent to participate: The China Health and Retirement Longitudinal Study was approved by the Ethics Review Committee of Peking University. The National Health and Nutrition Examination Survey were approved by the National Center for Health Statistics ethics review board. Written informed consent was obtained from all participants. Informed consent was obtained from each subject in these two cohorts. Consent for publication: This manuscript is not currently under consideration for publication elsewhere, and the work reported will not be submitted for publication elsewhere until a final decision has been made as to its acceptability by the journal. Competing interests: The authors declare no competing interests.
Figures

References
-
- Vogel B, Acevedo M, Appelman Y, et al. The Lancet women and cardiovascular disease commission: reducing the global burden by 2030. Lancet. 2021;397(10292):2385–438. 10.1016/s0140-6736(21)00684-x. - PubMed
-
- Feigin VL, Brainin M, Norrving B, et al. World Stroke Organization (WSO): Global stroke fact sheet 2022. Int J Stroke. 2022;17(1):18–29. 10.1177/17474930211065917. - PubMed
-
- Townsend N, Kazakiewicz D, Lucy Wright F, et al. Epidemiology of cardiovascular disease in Europe. Nat Rev Cardiol. 2022;19(2):133–43. 10.1038/s41569-021-00607-3. - PubMed
MeSH terms
Substances
Grants and funding
- 2023JGB039/Teaching Reform Program for Graduate Education at Central South University
- 2023JGYB041/the Hunan Provincial Degree and Graduate Education Reform Project
- R2023061/the Hunan Provincial Health High-Level Talent Scientific Research Project
- CPA-Z05-ZC-2024002/Additional funding was provided by the Research Project established by the Chinese Pharmaceutical Association Hospital Pharmacy Department
- 2024XQLH030/the Postgraduate Innovative Project of Central South University
LinkOut - more resources
Full Text Sources
Medical
