. 2025 Aug 5;5(1):45.
doi: 10.1186/s43897-025-00163-1.

Integrative metabolome and genome-wide transcriptome analyses reveal the regulatory network for bioactive compound biosynthesis in lettuce upon UV-A radiation

Affiliations

Integrative metabolome and genome-wide transcriptome analyses reveal the regulatory network for bioactive compound biosynthesis in lettuce upon UV-A radiation

Lingyan Zha et al. Mol Hortic. .

Abstract

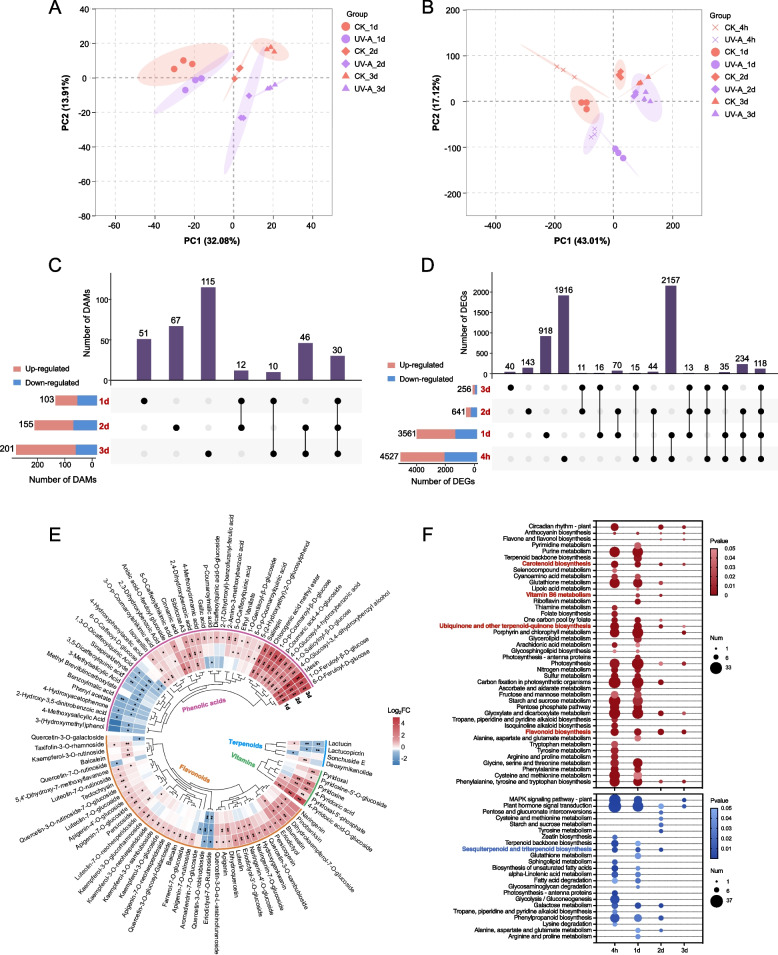
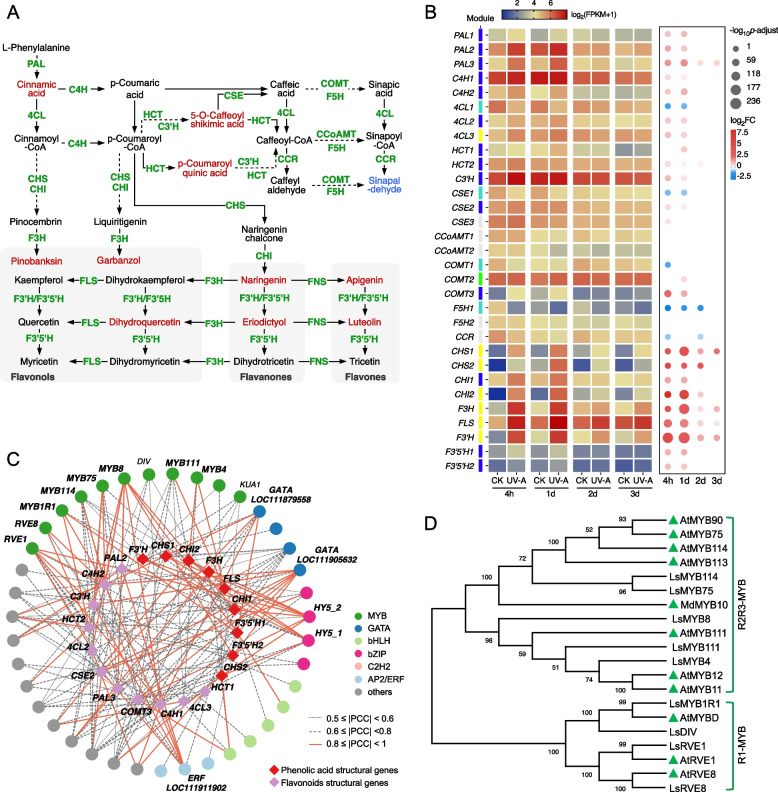
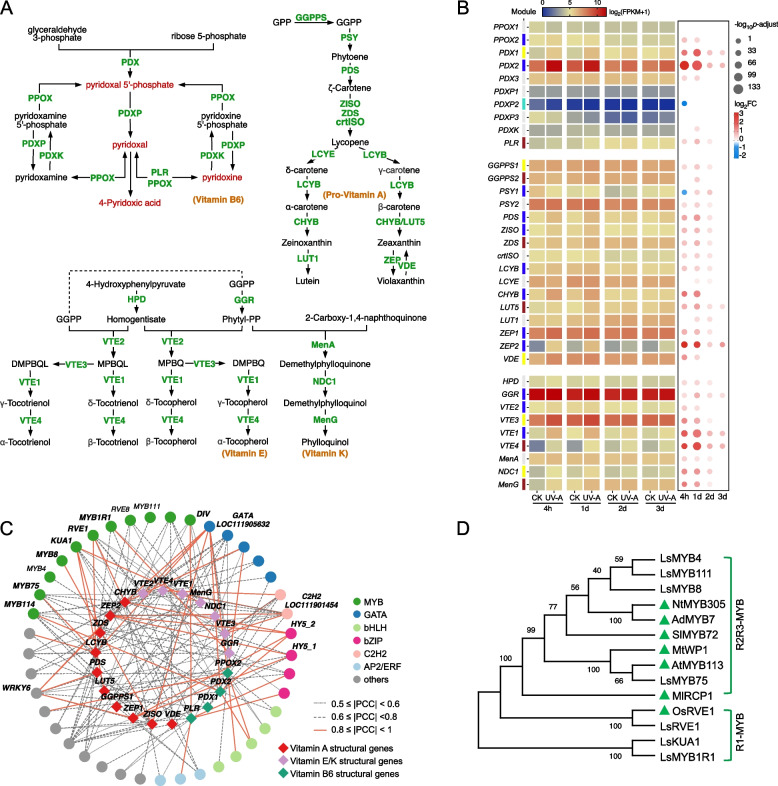
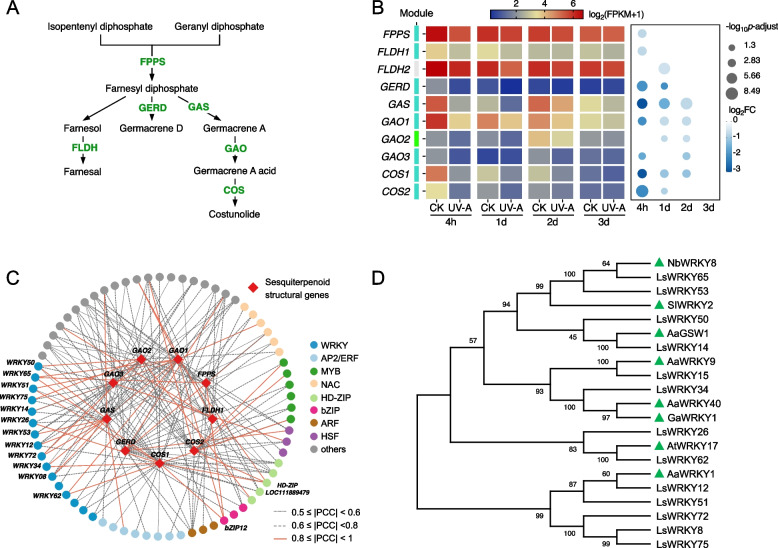
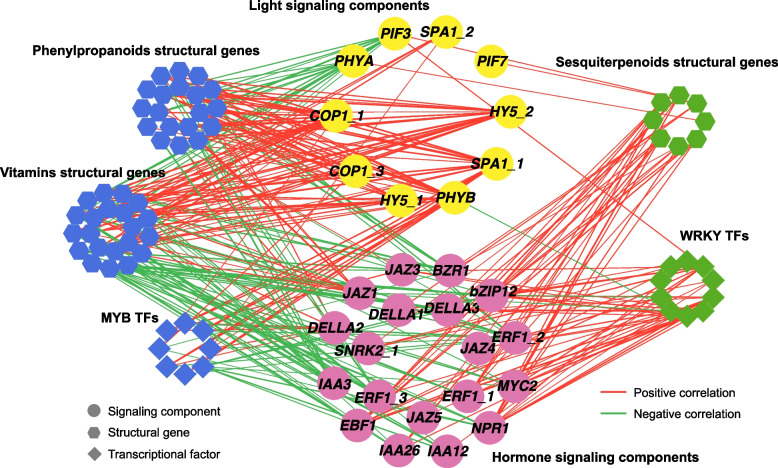
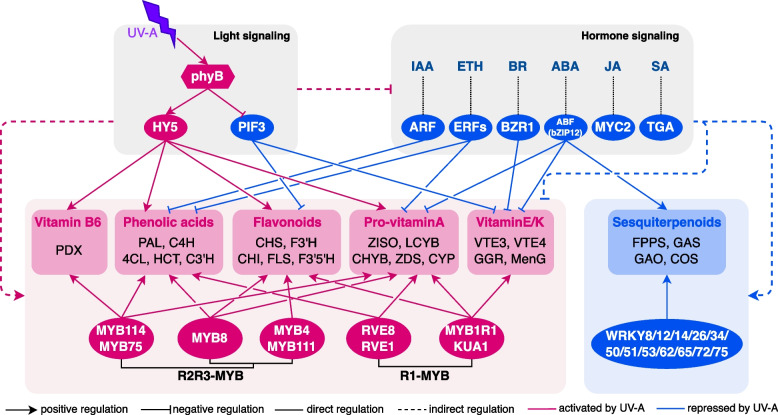
Ultraviolet A (UV-A) radiation possesses great potential for enhancing the bioactive properties of vegetables and also has promising application prospects in controlled-environment agriculture. Lettuce is a widely cultivated model vegetable in controlled-environment agriculture with abundant health-beneficial bioactive compounds. However, the comprehensive regulatory effectiveness and mechanism of UV-A on bioactive compounds in lettuce remain largely unclear. To address this issue, we performed transcriptomic and metabolomic analyses of UV-A-treated lettuce to construct a global map of metabolic features and transcriptional regulatory networks for all major bioactive compounds. Our study revealed that UV-A promotes the accumulation of most phenylpropanoids and vitamins (provitamin A and vitamin E/K1/B6) but represses the biosynthesis of sesquiterpenoids. MYB transcription factors (TFs) are key activators of bioactive compound biosynthesis promoted by UV-A, whereas WRKY TFs primarily inhibit the production of sesquiterpenoids. Moreover, light signaling plays a crucial and direct regulatory function in stimulating the biosynthesis of phenylpropanoids and vitamins but not in that of sesquiterpenoids. In comparison, hormone signaling dominates a more decisive regulatory role in repressing sesquiterpenoid biosynthesis through working directly and interacting with WRKY TFs. This study paves the way toward an understanding of the bioactive compound regulation and genetic improvement of lettuce bioactivity value.

Keywords: MYB; Phenylpropanoid; Sesquiterpenoid; Transcriptional regulation; Vitamin; WRKY.


Conflict of interest statement

Declarations. Ethics approval and consent to participate: Not applicable. Consent for publication: All authors approve the manuscript and consent to the publication of the work. Competing interests: The authors declare that they have no competing interests.

Figures

Fig. 1
Fig. 1
Effects of UV-A on the accumulation of bioactive compounds in lettuce at metabolic and transcriptional levels. A, B Principal component analysis for metabolomes (A) and transcriptomes (B). C, D UpSet plots of differentially accumulated metabolites (DAMs, VIP ≥ 1 and p-values ≤ 0.05) (C) and differentially expressed genes (DEGs, p-adjust ≤ 0.05 and |log2FC|≥ 0.58) (D) in comparison group of UV-A vs CK. E Heatmap illustrating the Log2FC of DAMs belonging to bioactive compounds in the comparison group of UV-A vs CK. The * and ** indicate p-values ≤ 0.05 and p-values ≤ 0.01 respectively. F KEGG enrichment analysis of up/down-regulated (red/blue) DEGs (p-adjust ≤ 0.05 and |log2FC|≥ 0.58) in the comparison group of UV-A vs CK
Fig. 2
Fig. 2
Weighted gene co-expression network analysis of total DEGs (UV-A vs CK, p-adjust ≤ 0.05, and |log2FC|≥ 0.58). A Clustering dendrogram of genes and module division. Each leaf represents a single gene, 6 modules were defined and coded by different colors. B Correlation between modules. C KEGG enrichment analysis of genes in each module. Pathways with p ≤ 0.05 were visualized by ClueGO of Cytoscape. The symbol size indicates the p-value, the smaller the p-value, the larger the size. Lines between symbols indicate the existence of connections between metabolic pathways. The color of symbols corresponds to the module color. D Number of TF family members in each module. The color of the columns corresponds to the module color
Fig. 3
Fig. 3
Comprehensive analysis and regulatory network of genes involved in phenylpropanoid biosynthesis in lettuce under UV-A. A Schematic of phenylpropanoid biosynthesis pathways. Compounds up-/down-regulated by UV-A are shown in red/blue fonts, respectively. B Heat map of the genes encoding structural enzymes involved in the phenylpropanoid biosynthesis pathways. The scaled values of FPKM and Log2FC were presented. C Regulatory network connecting predicted TFs and key structural genes had potential binding affinity (FIMO match p-value ≤ 1 e−4) and significant Pearson’s correlation (p ≤ 0.01). Expression correlations between TFs and structural genes are shown with line color and type. The full data set is available in Supplementary Table S3. D Phylogenetic tree of candidate MYB proteins with others related to phenylpropanoid biosynthesis. The known MYB proteins from other plants were remarked with green triangles. The accession numbers of protein sequences are available in Table S4
Fig. 4
Fig. 4
Comprehensive analysis and regulatory network of genes involved in vitamin biosynthesis in lettuce under UV-A. A Schematic of vitamin biosynthesis pathways. Compounds up-regulated by UV-A are shown in red. B Heat map of the genes encoding structural enzymes involved in the vitamin biosynthesis pathways. The scaled values of FPKM and Log2FC were presented. C Regulatory network connecting predicted TFs and key structural genes had potential binding affinity (FIMO match p-value ≤ 1e.−4) and significant Pearson’s correlation (p ≤ 0.01). Expression correlations between TFs and structural genes are shown with line color and type. The full data set is available in Supplementary Table S3. D Phylogenetic tree of candidate MYB proteins with others related to vitamin biosynthesis. The known MYB proteins from other plants were remarked with green triangles. The accession numbers of protein sequences are available in Table S4
Fig. 5
Fig. 5
Comprehensive analysis and regulatory network of genes involved in sesquiterpenoid biosynthesis in lettuce under UV-A. A Schematic of sesquiterpenoid pathway. B Heat map of the genes encoding structural enzymes involved in the sesquiterpenoid biosynthesis pathways. The scaled values of FPKM and Log2FC were presented. C Regulatory network connecting predicted TFs and key structural genes had potential binding affinity (FIMO match p-value ≤ 1e.−4) and significant Pearson’s correlation (p ≤ 0.01). Expression correlations between TFs and structural genes are shown with line color and type. The full data set is available in Supplementary Table S3. D Phylogenetic tree of candidate WRKY proteins with others related to sesquiterpenoid biosynthesis. The known WRKY proteins from other plants were remarked with green triangles. The accession numbers of protein sequences are available in Table S4
Fig. 6
Fig. 6
Regulatory effects of hub transcription factors on the promoter of LsCOS1. A Cis-elements on the promoter of LsCOS1 identified by Plant CARE. B Transcriptional regulatory network of LsCOS1. Circle color and line boldness represent the TF family and correlation coefficient, respectively. C Yeast one-hybrid analysis of the interaction of hub transcription factors (LsWRKY34, LsWRKY51, LsWRKY65, and LsbZIP12) and LsCOS1 promoter. D Schematic diagram of the constructs utilized in the dual-luciferase assay (left) and the corresponding LUC/REN ratios (right). Data are shown as mean ± SEM (n = 3). The asterisks indicate statistical significance (P < 0.05) using Student’s t-test
Fig. 7
Fig. 7
Correlation network of genes encoding light and hormone signaling with biosynthesis genes of bioactive compounds or identified candidate TFs. Circles, hexagons, and diamonds represent signaling genes, structural genes, and transcription factors, respectively. The weight of edges among nodes represents correlation coefficients
Fig. 8
Fig. 8
The schematic diagram represents the regulatory mechanisms that underlie UV-A regulation on the biosynthesis of bioactive compounds in lettuce. Ellipses represent transcription factors; rectangles represent target structural genes. Red and blue backgrounds indicate that gene expression or compound levels were up- and down-regulated by UV-A, respectively

Similar articles

References

    1. Agati G, Tattini M. Multiple functional roles of flavonoids in photoprotection. New Phytol. 2010;186(4):786–93. - PubMed
    1. Agati G, Azzarello E, Pollastri S, Tattini M. Flavonoids as antioxidants in plants: location and functional significance. Plant Sci. 2012;196:67–76. - PubMed
    1. Anilakumar KR, Harsha SN. Mallesha, Sharma RK, Lettuce: a promising leafy vegetable with functional properties. Def Life Sci J. 2017;2(2):178–85.
    1. Asensi-Fabado MA, Munne-Bosch S. Vitamins in plants: occurrence, biosynthesis and antioxidant function. Trends Plant Sci. 2010;15(10):582–92. - PubMed
    1. Bhat ZY, Mir JA, Yadav AK, Singh D, Ashraf N. CstMYB1R1, a REVEILLE-8-like transcription factor, regulates diurnal clock-specific anthocyanin biosynthesis and response to abiotic stress in Crocus sativus L. Plant Cell Rep. 2024;43(1):20. - PubMed

LinkOut - more resources