. 2025 Aug 4;15(1):28391.
doi: 10.1038/s41598-025-09780-8.

Prediction of the risk of transplant rejection based on RNA sequencing data of PBMCs before transplantation

Affiliations

Prediction of the risk of transplant rejection based on RNA sequencing data of PBMCs before transplantation

Yu Gong et al. Sci Rep. .

Abstract

Novel methods for detecting transplant rejection are craved, since conventional methods can detect ongoing rejection that may sometimes have already caused irreversible damage in transplanted organs. Here, we applied a transcriptomics database of recipients' peripheral blood mononuclear cells (PBMCs) before liver or kidney transplantation on the weighted gene co-expression network and machine learning models to evaluate the risk of rejection. Gene clusters positively correlated with rejection were enriched for genes related to antiviral response and regulation/production of interleukin-1(IL-1) in liver transplantation, and genes related to innate immune responses (IL-8 and toll-like receptor signaling pathways) and T cell responses were positively correlated with rejection in kidney transplantation. Our study presents a novel approach for feature engineering based on RNA-seq data of PBMCs collected before transplantation. The features derived from this method demonstrated potential in predicting the risk of rejection and may serve as candidate predictors in future clinically applicable models.

Keywords: Kidney transplantation; Liver transplantation; Peripheral blood mononuclear cells; RNA sequencing; Rejection.


Conflict of interest statement

Declarations. Competing interests: The authors declare no competing interests.

Figures

Fig. 1
Fig. 1
Weighted co-expression network based rejection prediction strategy. (a) Identifying modules in weighted co-expression networks that are related to traits (NR and R). (b) Using gene expression levels and gene significance in modules to perform feature engineering, and using the computed features to train and predict on machine learning models.
Fig. 2
Fig. 2
Identified and analyzed trait-related modules of LT in co-expression network. (a) WGCNA in LT patient-derived PBMCs, showing a hierarchical clustering tree of co-expression modules. Each module corresponds to a branch, which is labeled by a distinct color shown underneath. (b) WGCNA identifies 17 modules with highly correlated gene expression patterns in R and NR. Correlations between each module and R or NR are indicated by the intensity of red or blue color, respectively. p value for each module is shown in brackets. (c) The module membership and gene significance of genes within modules positively correlated with R. Each dot represents a gene within the corresponding module. (d) The module membership and gene significance of genes within modules positively correlated with NR. Each dot represents a gene within the corresponding module.
Fig. 3
Fig. 3
Analysis of gene modules of LT related to R or NR. (a) GO term analysis was performed on transcripts that were enriched in modules related to R. The y-axis represents the GO terms, the x-axis represents the number of assigned genes. (b) GO term analysis was performed on transcripts that were enriched in modules related to NR. The y-axis represents the GO terms, the x-axis represents the number of assigned genes.
Fig. 4
Fig. 4
The MF calculated based on gene modules of LT has discriminative power for R and NR. (a) The MF of each module that is positively correlated with R. (b) The MF of each module that is positively correlated with NR. (c) The 2 new MF generated by summing the MFs of the corresponding modules in (a) and (b). (d) Using precision, recall, accuracy and AUC to evaluate the predictive power of the MF in (a) and (b). (e) Using the MF in (c) to discriminate between R and NR subjects.
Fig. 5
Fig. 5
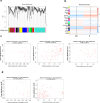
Identified and analyzed trait-related modules of KT in co-expression network. (a) WGCNA in KT patient-derived PBMCs, showing a hierarchical clustering tree of co-expression modules. Each module corresponds to a branch, which is labeled by a distinct color shown underneath. (b) WGCNA identifies 12 modules with highly correlated gene expression patterns in R and NR. Correlations between each module and R or NR are indicated by the intensity of red or blue color, respectively. p value for each module is shown in brackets. (c) The module membership and gene significance of genes within modules positively correlated with R. Each dot represents a gene within the corresponding module. (d) The module membership and gene significance of genes within module es positively correlated with NR. Each dot represents a gene within the corresponding module. (e) GO term analysis was performed on transcripts that were enriched in modules related to R. The y-axis represents the GO terms, the x-axis represents the number of assigned genes. (f) GO term analysis was performed on transcripts that were enriched in modules related to NR. The y-axis represents the GO terms, the x-axis represents the number of assigned genes.
Fig. 6
Fig. 6
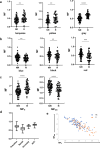
The MF calculated based on gene modules of KT has discriminative power for R and NR. (a) The MF of each module that is positively correlated with R. (b) The MF of each module that is positively correlated with NR. (c) The 2 new MF generated by summing the MFs of the corresponding modules in (a) and (b). (d) Using precision, recall, accuracy and AUC to evaluate the predictive power of the MF in (a) and (b). (e) Using the MF in (c) to discriminate between R and NR subjects.

Similar articles

References

    1. Beck, J. et al. Donor-derived cell-free DNA is a novel universal biomarker for allograft rejection in solid organ transplantation. Transpl. Proc.47, 2400–2403 (2015). - PubMed
    1. Black, C. K., Termanini, K. M., Aguirre, O., Hawksworth, J. S. & Sosin, M. Solid organ transplantation in the 21st century. Ann. Transl. Med.6, 409 (2018). - PMC - PubMed
    1. Tapiawala, S. N. et al. Delayed graft function and the risk for death with a functioning graft. J. Am. Soc. Nephrol.21, 153–161 (2010). - PMC - PubMed
    1. Snyder, T. M., Khush, K. K., Valantine, H. A. & Quake, S. R. Universal noninvasive detection of solid organ transplant rejection. Proc. Natl. Acad. Sci.108, 6229–6234 (2011). - PMC - PubMed
    1. Siedlecki, A., Irish, W. & Brennan, D. C. Delayed graft function in the kidney transplant. Am. J. Transplant.11, 2279–2296 (2011). - PMC - PubMed

MeSH terms

LinkOut - more resources