

Leveraging geographic information system for dengue surveillance: a scoping review
- PMID: 40760031
- PMCID: PMC12320306
- DOI: 10.1186/s41182-025-00783-9
Leveraging geographic information system for dengue surveillance: a scoping review
Abstract
Background: Vector-borne diseases caused by Aedes mosquitoes remain a major public health concern across tropical and subtropical regions. Geographic Information Systems (GIS) have become integral in surveillance by enabling spatial analysis, risk mapping, and predictive modelling. This scoping review explores how GIS has been applied in surveillance studies and identifies its potential applications, key variables, modelling approaches, and challenges.
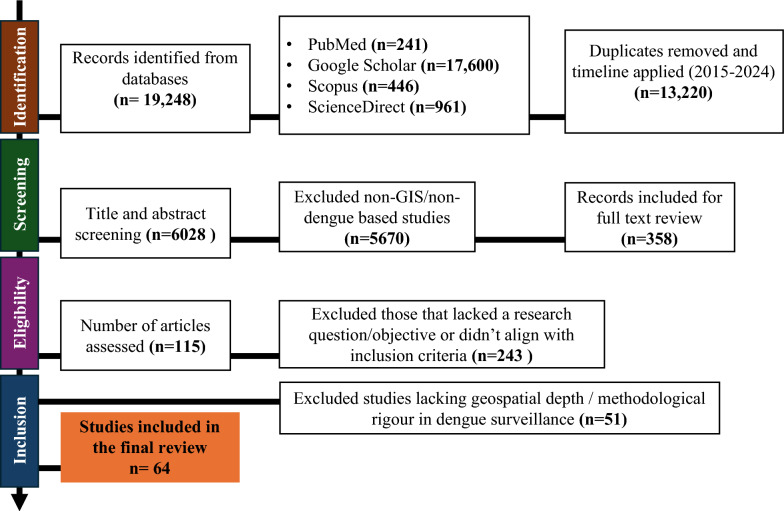
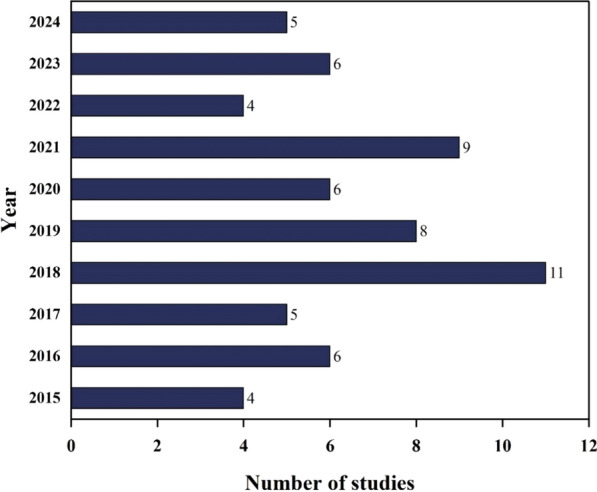
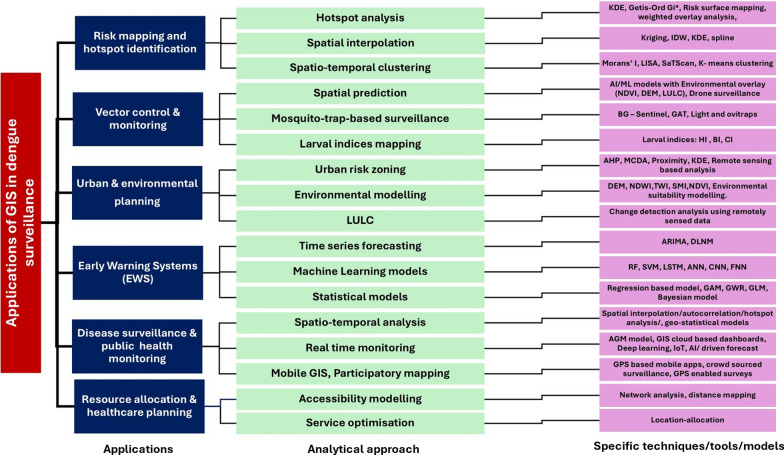
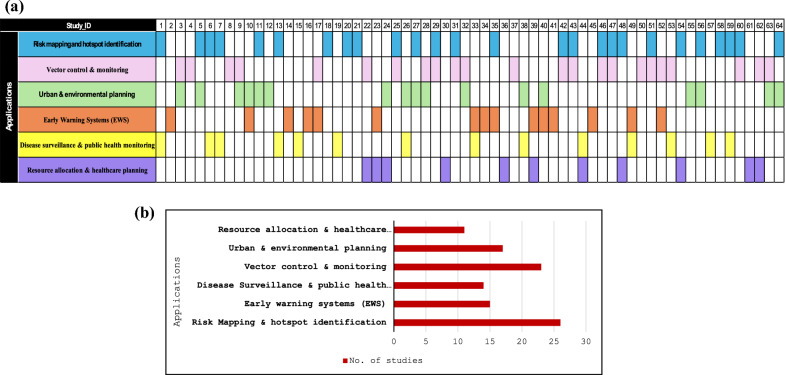
Methods: This scoping review was conducted following PRISMA-ScR guidelines and was structured using a search strategy to identify relevant peer-reviewed articles published between 2015 and 2024 across databases like PubMed, Scopus, ScienceDirect, and Google Scholar. A total of 64 studies were selected and charted based on geographic focus, GIS applications, modelling techniques, spatial methods, and key variables.
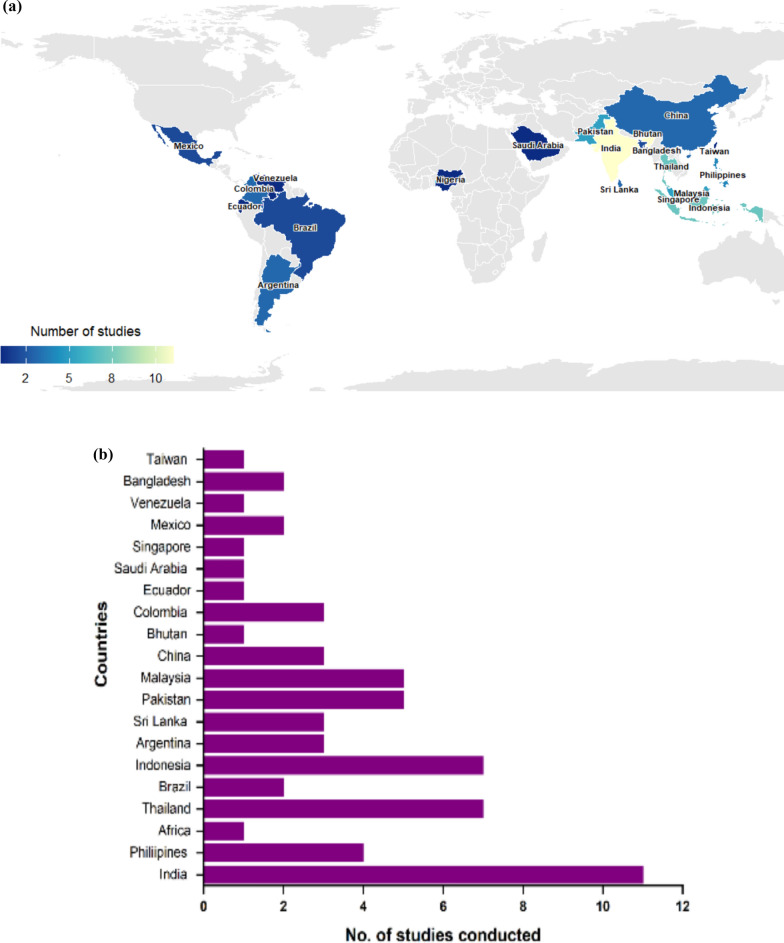
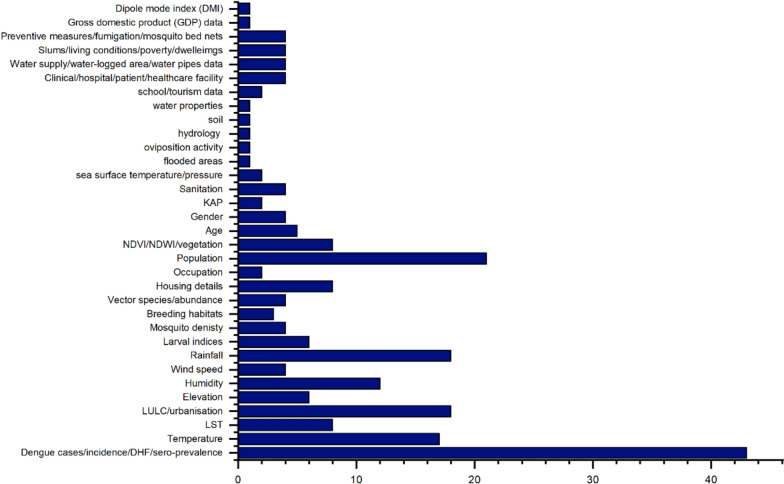
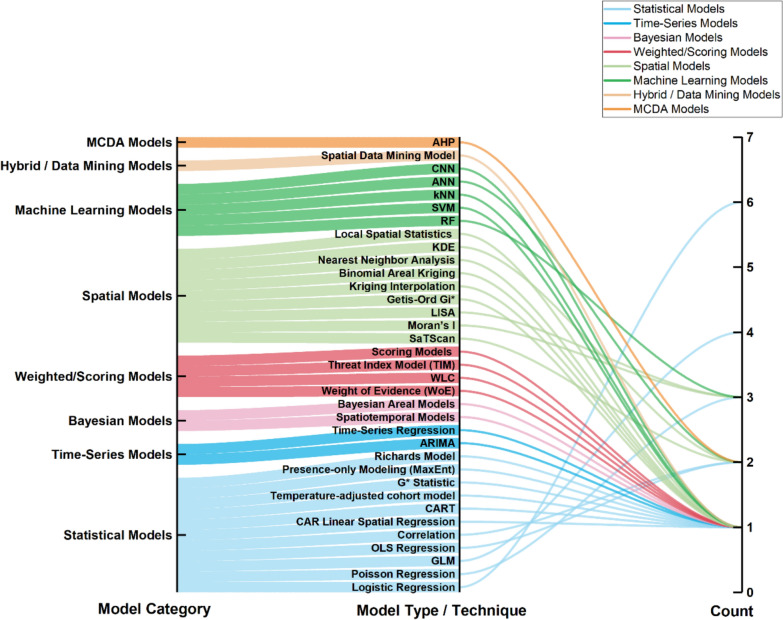
Results: A notable concentration of studies was found in South and Southeast Asia, reflecting the high disease burden and research activity in these regions. ArcGIS and QGIS were the most frequently used platforms in dengue surveillance around the globe. Risk mapping and hotspot detection were the most frequent targeted applications (n = 26), followed by vector control and monitoring (n = 23). Environmental and climatic variables were commonly analysed, including temperature, rainfall, humidity, and Normalised Difference Vegetation Index. Common analytical methods included regression-based spatial models and, increasingly, machine learning techniques along with GIS. Emerging trends include integrating machine learning models, remote sensing data, and mobile GIS for real-time monitoring and early warning systems.
Conclusions: GIS has evolved from a mapping tool into a multidimensional decision-support system in disease surveillance. Its integration with environmental, climatic, and demographic data enables proactive outbreak management and targeted interventions. Future research should leverage Artificial Intelligence, machine learning, the Internet of Things, participatory GIS, and interdisciplinary data to enhance surveillance prediction and public health response. Strengthening collaborative data-sharing frameworks and incorporating machine-learning approaches could further improve the effectiveness of GIS-driven surveillance programs.
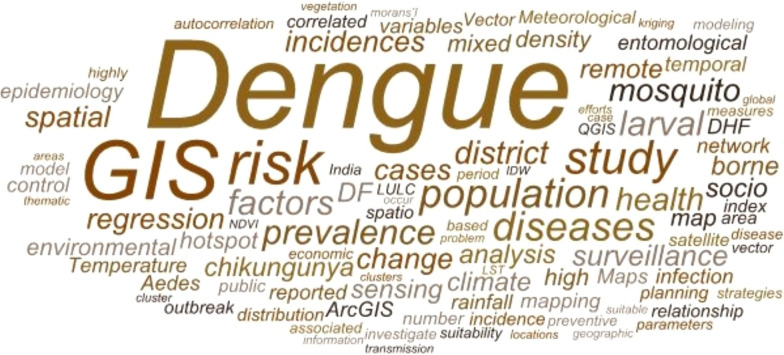
Keywords: Dengue; Disease surveillance; Geographic information systems; Public health; Spatial analysis; Vector-borne diseases.
© 2025. The Author(s).
Conflict of interest statement
Declarations. Ethics approval and consent to participate: This study is a scoping review of published literature and does not involve human participants, animal subjects, or primary data collection. Therefore, ethical approval was not required. Consent for publication: Not applicable. Competing interest: The authors declare no competing interests.
Figures
Similar articles
-
Cost-effectiveness of using prognostic information to select women with breast cancer for adjuvant systemic therapy.Health Technol Assess. 2006 Sep;10(34):iii-iv, ix-xi, 1-204. doi: 10.3310/hta10340. Health Technol Assess. 2006. PMID: 16959170
-
Health professionals' experience of teamwork education in acute hospital settings: a systematic review of qualitative literature.JBI Database System Rev Implement Rep. 2016 Apr;14(4):96-137. doi: 10.11124/JBISRIR-2016-1843. JBI Database System Rev Implement Rep. 2016. PMID: 27532314
-
Technological trends in epidemic intelligence for infectious disease surveillance: a systematic literature review.PeerJ Comput Sci. 2025 May 6;11:e2874. doi: 10.7717/peerj-cs.2874. eCollection 2025. PeerJ Comput Sci. 2025. PMID: 40567698 Free PMC article.
-
Using nursing data for machine learning-based prediction modeling in intensive care units: A scoping review.Int J Nurs Stud. 2025 Sep;169:105133. doi: 10.1016/j.ijnurstu.2025.105133. Epub 2025 Jun 7. Int J Nurs Stud. 2025. PMID: 40544524
-
The measurement and monitoring of surgical adverse events.Health Technol Assess. 2001;5(22):1-194. doi: 10.3310/hta5220. Health Technol Assess. 2001. PMID: 11532239
References
-
- Ocampo CB, Mina NJ, Echavarria MI, Acuña M, Caballero A, Navarro A, et al. VECTOS: an integrated system for monitoring risk factors associated with urban arbovirus transmission. www.ghspjournal.org - PMC - PubMed
-
- Jing Q, Wang M. Dengue epidemiology. Glob Health J. 2019;3:37–45.
-
- World Health Organisation. Vector-borne diseases; 2023. https://www.who.int/news-room/fact-sheets/detail/vector-borne-diseases
-
- A A Aminda Chinthaka, LRK Kahandagamage, Amaranath D, De Silva S. Communicable disease surveillance and response system. http://www.cdc.gov/violenceprevention/youthviolence/s
Publication types
LinkOut - more resources
Full Text Sources