. 2025 Aug 4;4(1):30.
doi: 10.1038/s44185-025-00099-1.

Uncovering diversity and abundance patterns of CO2-fixing microorganisms in peatlands

Affiliations

Uncovering diversity and abundance patterns of CO2-fixing microorganisms in peatlands

Marie Le Geay et al. NPJ Biodivers. .

Abstract

Microorganisms play a crucial role in the carbon (C) dynamics of peatlands - a major terrestrial C reservoir. Because of their role in C emissions, heterotrophic microorganisms have attracted much attention over the past decades. CO2-fixing microorganisms (CFMs) remained largely overlooked, while they could attenuate C emissions. Here, we use metabarcoding and digital droplet PCR to survey microorganisms that potentially fix CO2 in different peatlands. We demonstrate that CFMs are abundant and diverse in peatlands, with on average 1021 CFMs contributing up to 40% of the total bacterial abundance. Using a joint-species distribution model, we identified a core and a specific CFM microbiome, the latter being influenced by temperature and nutrients. Our findings highlight that ASV richness and community structure were direct drivers of CFM abundance, while environmental parameters were indirect drivers. These results provide the basis for a better understanding of the role of CFMs in peatland C cycle inputs.


Conflict of interest statement

Competing interests: The authors declare no competing interests.

Figures

Fig. 1
Fig. 1. Principal component analysis (PCA) of all environmental variables.
a Sample positioning in the PCA ordination space and b environmental variables contribution to PC axis 1 and 2. Black arrows represent dissolved organic matter quality, metabolites and water table depth variables, blue arrows and text highlight nutrient variables, and red arrows and text, variables related to climatic condition as well as pH. DOC dissolved organic carbon, TN total nitrogen, RFE relative fluorescence efficiency, BIX biological index, FI fluorescence index, SST spring soil temperature, SAT spring air temperature, SP spring precipitation, SWTD spring water table depth, WST winter soil temperature, WAT winter air temperature, WP winter precipitation and WWTD winter water table depth.
Fig. 2
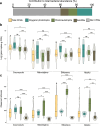
Fig. 2. CFM abundance, richness and their response to environmental variables.
a Average contribution of the different CFMs to total bacterial abundance (16S rRNA gene). b Absolute quantification using ddPCR, and c Observed richness of total CFMs (sum of 23S rRNA, cbbL and pufM/bchYgenes), oxygenic phototrophs (23S rRNA gene), chemoautotrophs (cbbL) and AAnPBs (pufM/bchY) for each site. Violin plots are showing the data distribution shape while boxplots are representing the logarithm of the total gene copies.g−1 DW. D1 = 0–5 cm; D2 = 5–10 cm and D3 = 10–15 cm. ns not significant; *: P < 0.05, **: P < 0.01 and ***: P < 0.001.
Fig. 3
Fig. 3. Multiple factor analysis (MFA) samples biplot.
a MFA for 23S rRNA, cbbL and bchY genes ASV matrices. Geometric shapes represent each sample spilt according to depth and colors represent the four peatlands. b Pie charts represent the relative abundance of the different clusters (for the same samples) generated under the Joint Species Distribution Model (JSDM; see Fig. 5). Gray lines represent results of a hierarchical agglomerative clustering.
Fig. 4
Fig. 4. Impact of location and depth on relative abundance of ASVs aggregated by class.
a Heatmaps showing the relative abundance (%) of ASVs aggregated by class according to location and depth. Only classes with abundance higher than 5% were kept. Light color represents low abundances while dark color represents higher abundances. b P-values from linear mixed effects models showing the effects of location, depth and location with depth on the relative abundance of each class. L location, D depth, ns not significant; *: P < 0.05, **: P < 0.01 and ***: P < 0.001; D1 = 0–5 cm; D2 = 5–10 cm and D3 = 10–15 cm.
Fig. 5
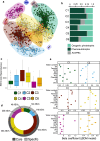
Fig. 5. Co-occurrence network of the variation between ASVs caused by environmental parameters.
a Clusters of co-occurring ASVs with each dot representing one ASV. b Barplot of the relative abundance of each microbial group within each cluster. c Niche size (hypervolumes) of each cluster. d Absolute distribution of ASVs into the six clusters and according if these ASVs are considered as core microbiome ASVs (dark gray) or specific microbiome ASVs (light gray). e Mean of beta coefficient from the JSDM model showing how environmental parameters are affecting the clusters. C1 cluster 1, C2 cluster 2, C3 cluster 3, C4 cluster 4, C5 cluster 5, C6 cluster 6, TN total nitrogen; DOC dissolved organic carbon; SST spring soil temperature; WTD water table depth; D1 = 0–5 cm; D2 = 5–10 cm and D3 = 10–15 cm.
Fig. 6
Fig. 6. Drivers of absolute quantification of CO2-fixing microorganisms (CFMs) in peatlands.
a Variation partitioning modeling evaluating the unique and shared portions of variation in CFM abundance. CFM features refer to ASV richness (S), alpha diversity (Shannon) and community composition (MFA axis 1 and 2); CFM clusters refers to relative abundance of species from clusters 1 to 4 generated by the JSDM model; Climatic conditions refer to WTD, SP and SST; Chemical compounds refer to tannins, phenols, DOC, K+, pH, TN, PO42- and Br- and Shared refers to the percentage of shared variation explained by all predictors. b Results from random forest analysis showing the relative importance of the different drivers of the absolute quantification of CFMs in peatlands. WTD water table depth, SP spring precipitation, SST spring soil temperature, DOC dissolved organic carbon, TN total nitrogen.

Similar articles

References

    1. Nichols, J. E. & Peteet, D. M. Rapid expansion of northern peatlands and doubled estimate of carbon storage. Nat. Geosci.12, 917–921 (2019).
    1. Rydin, H. & Jeglum, J. K. The biology of peatlands. 10.1093/ACPROF:OSO/9780198528722.001.0001 (2006).
    1. Strack, M., Davidson, S. J., Hirano, T. & Dunn, C. The potential of peatlands as nature-based climate solutions. Curr. Clim. Change Rep.8, 71–82 (2022).
    1. Hopple, A. M. et al. Massive peatland carbon banks vulnerable to rising temperatures. Nat. Commun.10.1038/s41467-020-16311-8 (2020). - PMC - PubMed
    1. Hamard, S., Küttim, M., Céréghino, R. & Jassey, V. E. J. Peatland microhabitat heterogeneity drives phototrophic microbe distribution and photosynthetic activity. Environ. Microbiol.23, 6811–6827 (2021). - PubMed

LinkOut - more resources