. 2025 Aug 4;8(1):1150.
doi: 10.1038/s42003-025-08615-6.

A pilot multi-omics study reveals genetic mechanisms regulating milk component traits in dairy cattle

Affiliations

A pilot multi-omics study reveals genetic mechanisms regulating milk component traits in dairy cattle

Weijie Zheng et al. Commun Biol. .

Abstract

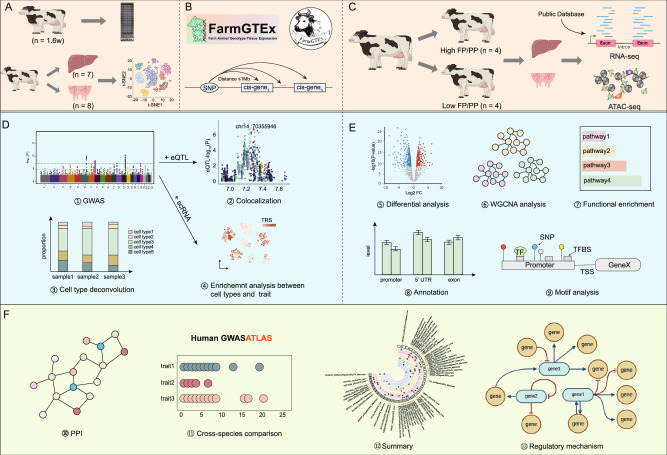
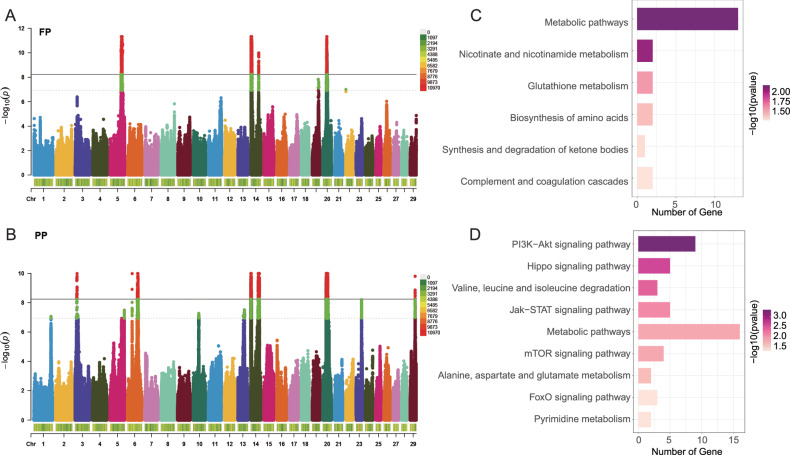
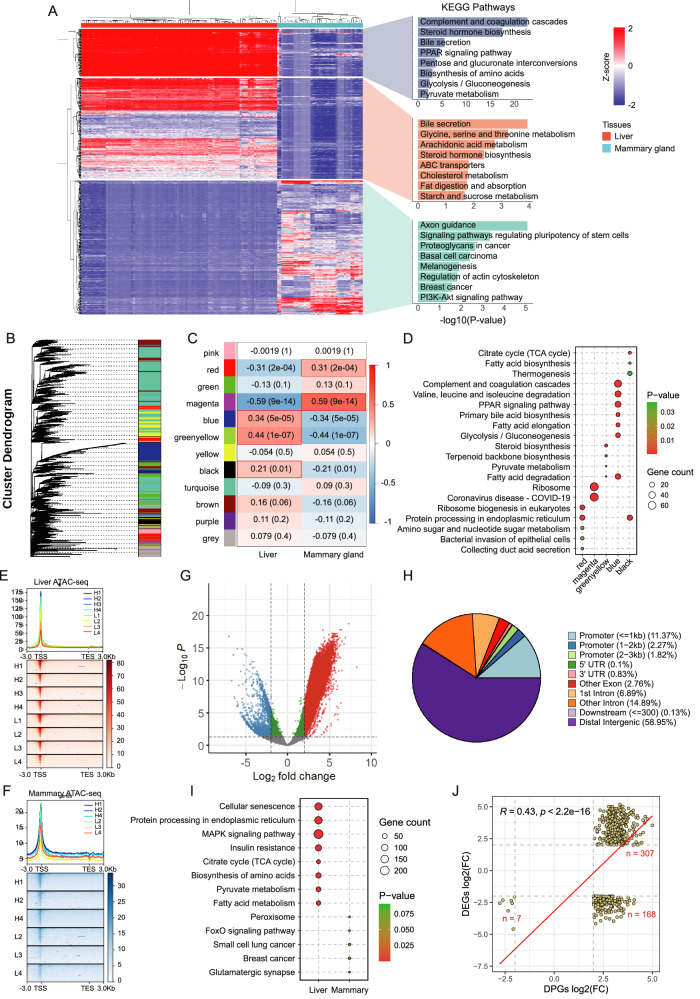
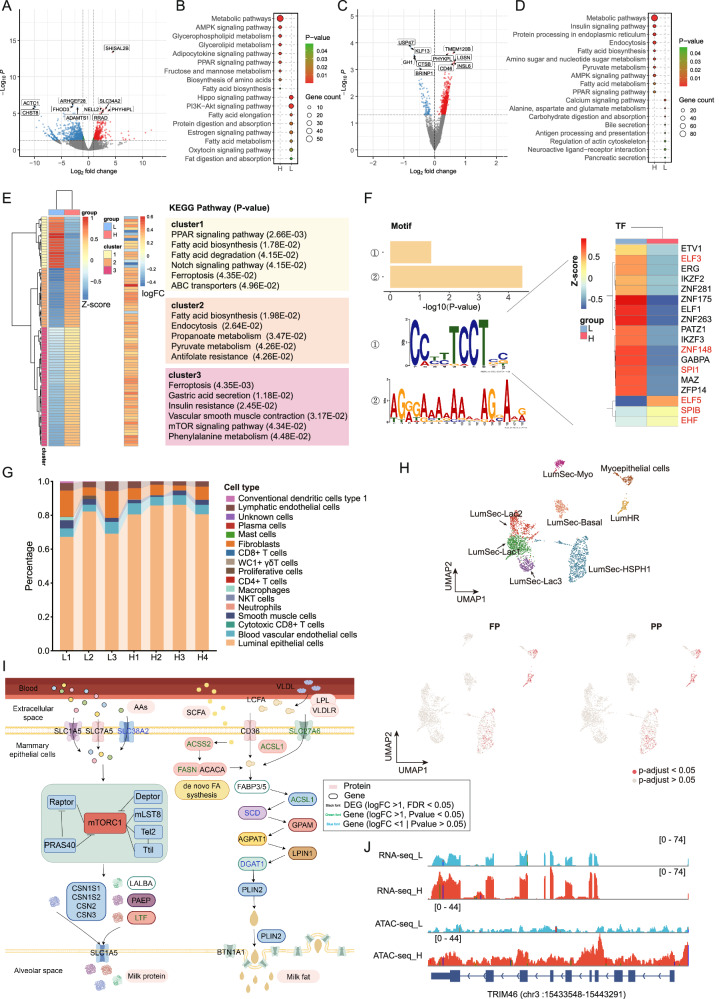
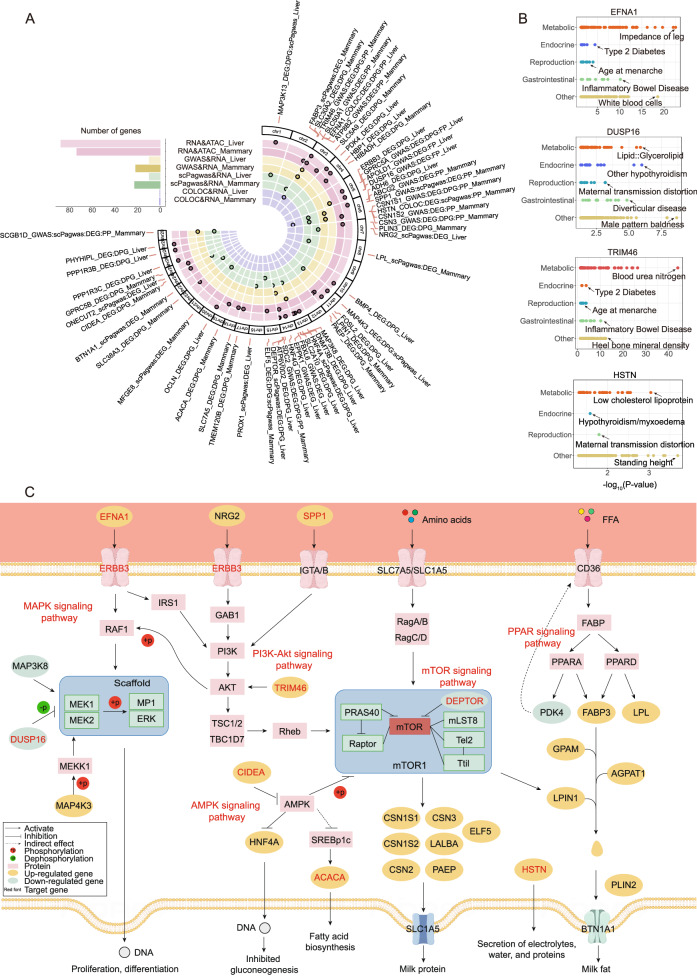
Milk protein percentage (PP) and fat percentage (FP) are important indicators for measuring milk quality, but only a few causative genes such as DGAT1, GHR, and ABCG2, have been identified, indicating substantial potential for further exploration. Here, we integrated genotyping, RNA-seq, ATAC-seq, single-cell atlas and cis-QTLs datasets from the liver and mammary gland to investigate their genetic regulation. We identified cell type affecting milk composition, such as HPE2 and LumSec-HSPH1, and highlighted nine candidate genes (EFNA1, ERBB3, DUSP16, DEPTOR, TRIM46, HSTN, CIDEA, ACACA and SPP1) that are involved in the regulation of milk protein and fat synthesis through MAPK, AMPK, PI3K-Akt, and mTOR signalling pathways. Notably, EFNA1 was consistently identified across all omics analyses, showing increased promoter accessibility in the high PP group, potentially driven by CTCF and RXRA-mediated transcriptional activation. Overall, this study reveals potential cell types, candidate genes, and regulatory mechanisms influencing milk composition, offering insights to support milk quality improvement. The limited sample size represents the main constraint of this work, and future efforts will focus on population-scale genetic analyses and wet-lab validation.


Conflict of interest statement

Competing interests: The authors declare no competing interests.

Figures

Fig. 1
Fig. 1. Schematic diagram of the study.
A Genotyping datasets of 16,188 Chinese Holstein cattle and the previously constructed liver and mammary gland single-cell atlas. B Cis-QTL summary from the cattleGTEx. C RNA-seq, WGBS, and ATAC-seq were performed on liver and mammary glands. D, E Major bioinformatics and statistical analyses involved in the study. F Multiomics integration analysis. Images created in BioRender. u3, u7. (2025; https://BioRender.com/0re8pwv).
Fig. 2
Fig. 2. GWAS results of milk protein percentage and milk fat percentage.
A, B Manhattan plot of FP and PP. C, D KEGG enrichment analysis of genes significantly associated with the FP and PP.
Fig. 3
Fig. 3. Analysis of liver and mammary gland heterogeneity.
A Heatmap of the expression levels of differentially expressed genes across tissues and KEGG enrichment pathways of genes in different modules. P value was calculated with two-sided and adjusted by multiple comparisons (FDR). B Hierarchical clustering diagram showing the construction of a coexpression network based on the optimal soft threshold, dividing the genes into different modules to generate a gene clustering tree. C Heatmap representing cross-tissue WGCNA. Values indicate Pearson’s correlation and significance thresholds for modules and subgroups. D KEGG enrichment pathways of modules that are significantly associated with each tissue. P value was calculated with two-sided and adjusted by multiple comparisons (FDR). E, F Distribution of the peaks in the liver and mammary glands upstream and downstream of the 3 kb region of the TSS. G Volcano plot displaying differential peaks across tissues. H Annotations of the functional elements of the differentially accessible peaks. I KEGG enrichment pathways of genes with differential peaks. J Scatter plot showing the Pearson’s correlation between the gene expression levels of DPGs and DEGs.
Fig. 4
Fig. 4. Multiomics analysis of the liver.
A, C Volcano plot displaying differentially expressed genes and differential peak genes between groups. B, D Scatter plot displaying the KEGG pathways associated with the DEGs and DPGs. E Motif analysis. From left to right: the expression patterns of overlapping genes between the DEGs and DPGs in the high and low groups (z-score was calculated after normalization of expression levels), GO enrichment of genes in the clustering modules, differences in chromatin accessibility between the groups. Motif analysis was performed on differential chromatin accessibility peaks located in the promoter regions of genes overlapping between DEGs and DPGs, followed by examination of the expression levels of TFs predicted to bind these motifs; F Enrichment of GWAS signals associated with PP and FP across various cell subtypes in the liver. P value was calculated with two-sided and adjusted by multiple comparisons (FDR); G Transcriptome expression, chromatin accessibility landscape, and potential regulatory mechanisms of EFNA1. The peak track represents the read count from RNA-seq and ATAC -seq of liver samples in the high and low groups. Scatter plot shows the colocalization results of GWAS and eQTL. Heatmap indicates the linkage disequilibrium (LD) between SNPs. The central boxes represent motifs predicted in the three differential peak, with the corresponding predicted transcription factors shown below each motif.
Fig. 5
Fig. 5. Multiomics analysis of the mammary gland.
A, C Volcano plot displaying differentially expressed genes and differential peak genes between groups. B, D Scatter plot displaying the KEGG pathways associated with the DEGs and DPGs. E Motif analysis. From left to right: the expression patterns of overlapping genes between the DEGs and DPGs in the high and low groups (z score was calculated after normalization of expression levels), GO enrichment of the genes in clustering modules, differences in chromatin accessibility between the groups; F Motif analysis was performed on differential chromatin accessibility peaks located in the promoter regions of genes overlapping between DEGs and DPGs, followed by examination of the expression levels of TFs predicted to bind these motifs; G Cell-type proportions in the mammary gland were deconvolved by integrating bulk RNA-seq and scRNA-seq data; H Enrichment of GWAS signals associated with PP and FP across various cell subtypes. P value was calculated with two-sided and adjusted by multiple comparisons (FDR); I Schematic diagram of the pathway of milk fat and milk protein synthesis in the mammary gland; J Transcriptome expression and chromatin accessibility landscape of TRIM46.
Fig. 6
Fig. 6. Milk fat and protein functional genes and regulatory mechanisms.
A Identification of functional genes via different methods. The bar chart represents the number of differentially expressed genes that were identified by a single omics analysis, the circle chart represents the position of candidate genes on the genome, and the outermost edge represents the gene label in the format of gene_methods_tissues. B Phenotype-wide Association Study (PheWAS) shows candidate genes for cow’s milk composition are strongly associated with complex traits in humans. C The KEGG regulatory network formed by candidate functional genes involved in lipid and protein synthesis.

Similar articles

References

    1. Roy, D., Ye, A., Moughan, P. J. & Singh, H. Composition, structure, and digestive dynamics of milk from different species-a review. Front. Nutr.7, 577759 (2020). - PMC - PubMed
    1. Aschenbach, J. R., Kristensen, N. B., Donkin, S. S., Hammon, H. M. & Penner, G. B. Gluconeogenesis in dairy cows: the secret of making sweet milk from sour dough. IUBMB Life62, 869–877 (2010). - PubMed
    1. Rawson, P. et al. Metabolic proteomics of the liver and mammary gland during lactation. J. Proteom.75, 4429–4435 (2012). - PubMed
    1. Grisart, B. et al. Positional candidate cloning of a QTL in dairy cattle: identification of a missense mutation in the bovine DGAT1 gene with major effect on milk yield and composition. Genome Res.12, 222–231 (2002). - PubMed
    1. Grisart, B. et al. Genetic and functional confirmation of the causality of the DGAT1 K232A quantitative trait nucleotide in affecting milk yield and composition. Proc. Natl. Acad. Sci. USA101, 2398–2403 (2004). - PMC - PubMed

LinkOut - more resources