. 2025 Aug 4;15(1):28450.
doi: 10.1038/s41598-025-13346-z.

Predicting head and neck cancer response to radiotherapy with a chemokine-based model

Affiliations

Predicting head and neck cancer response to radiotherapy with a chemokine-based model

Jinzhi Lai et al. Sci Rep. .

Abstract

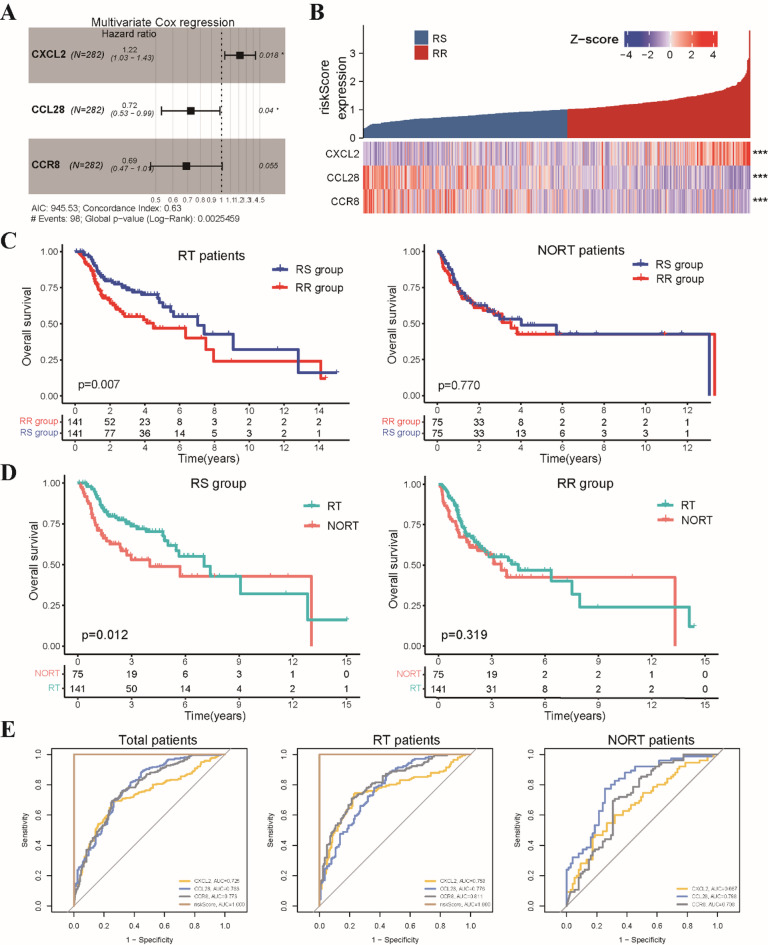
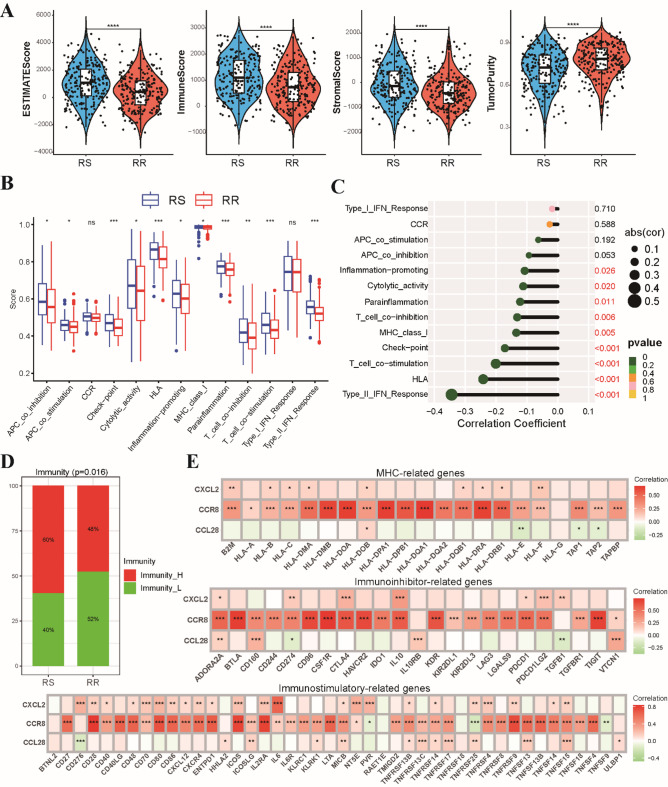
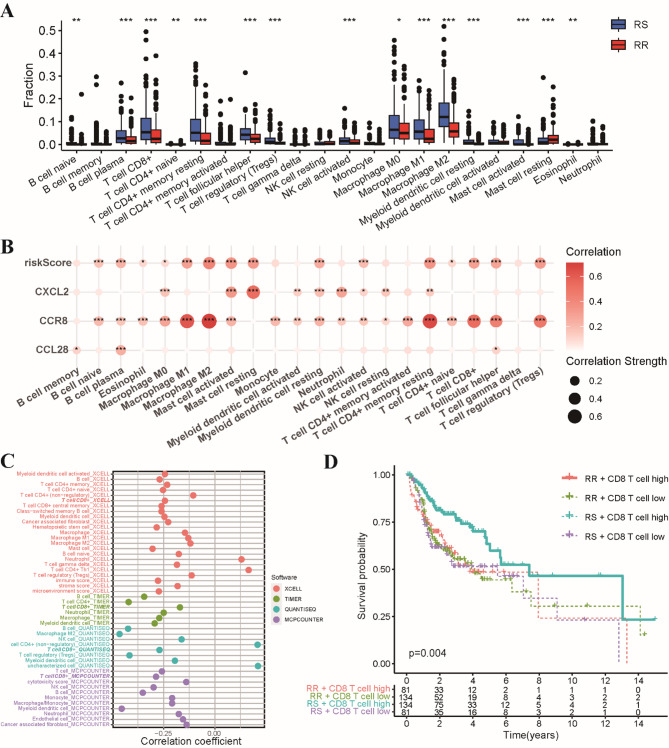
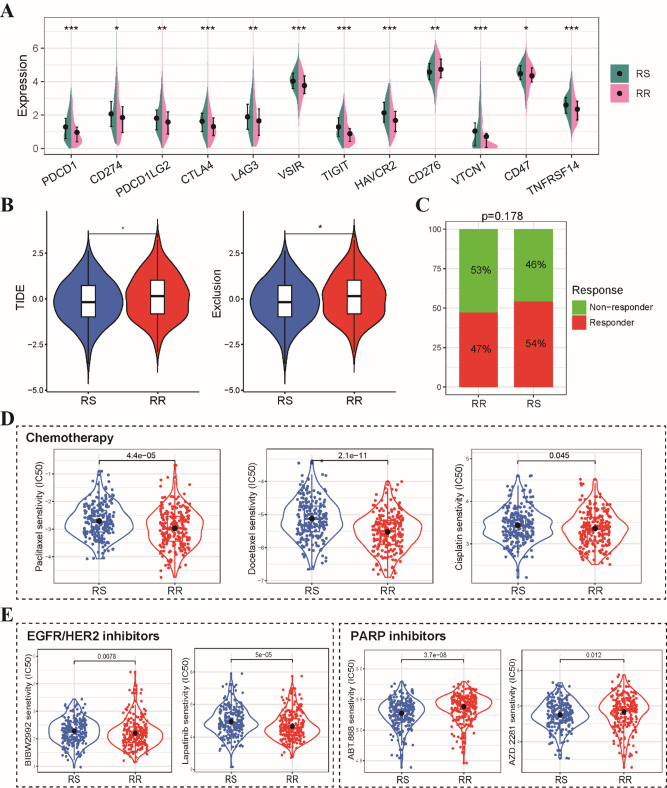
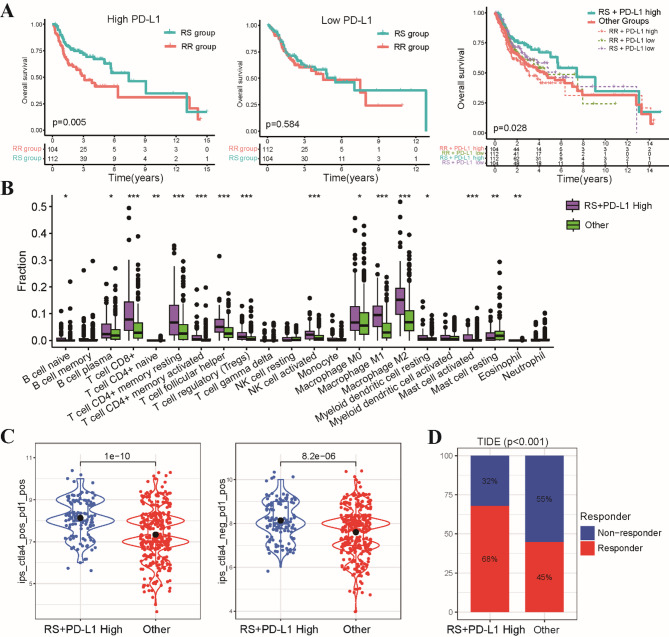
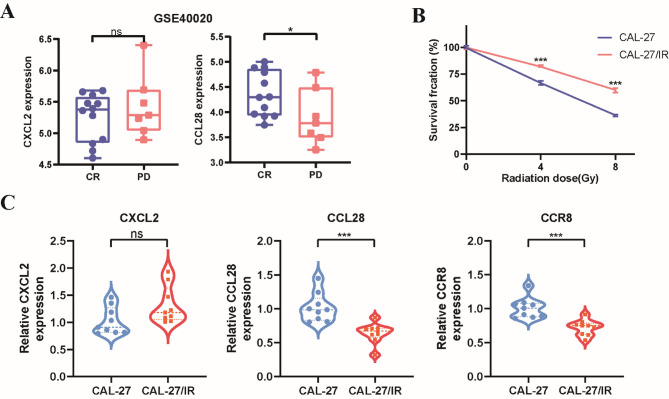
Radiotherapy resistance remains a major challenge in Head and neck squamous cell carcinoma (HNSCC) treatment. This study aimed to develop a chemokine-based model for predicting radiosensitivity in HNSCC using a retrospective analysis of 432 patients from the TCGA database. We identified a model incorporating CXCL2, CCL28, and CCR8 expression that effectively stratified patients into radiosensitive (RS) and radioresistant (RR) groups. Patients in the RS group demonstrated significantly improved overall survival (OS) with radiotherapy, whereas this prognostic advantage was not observed in the non-radiotherapy group. Notably, patients within the RS group with high PD-L1 expression exhibited even better OS and increased immune infiltration, indicating a synergistic relationship between radiosensitivity and PD-L1 expression. Further analyses revealed enrichment of immune-related pathways and higher effector immune cell abundance in the RS group, suggesting greater potential for immunotherapy response. Corroborating these findings, analysis of the GSE40020 cohort showed significant upregulation of CCL28 in patients with complete response compared to those with post-treatment failure. In vitro experiments using radiosensitive and radioresistant Tongue squamous cell carcinoma (TSCC) cell lines validated the association between chemokine gene expression and radiosensitivity. Our model provides a valuable tool for identifying HNSCC patients who may benefit from combined treatment strategies incorporating synergistic anti-tumor agents.


Conflict of interest statement

Declarations. Competing interests: The authors declare no competing interests.

Figures

Fig. 1
Fig. 1
Construction of a chemokine-based radiosensitivity model in the TCGA-HNSCC cohort. (A) Forest plot illustrating hazard ratios and corresponding 95% confidence intervals for the three genes comprising the radiosensitivity model, as determined by multivariate Cox regression analysis. (B) The heatmap visualizes the expression profiles of the three genes composing the radiosensitivity model across RS and RR groups. (C) The Kaplan-Meier curves depicts the impact of radiosensitivity on OS stratified by radiotherapy status (RT/Non-RT patients). (D) The Kaplan-Meier curves illustrates OS within each radiosensitivity group (RS/RR groups) for patients receiving radiotherapy compared to non-radiotherapy. (E) ROC curves showing the capacity of risk model to predict radiosensitivity in the HNSCC patients. * p < 0.05, *** p < 0.001.
Fig. 2
Fig. 2
Association of the radiosensitivity model with clinicopathological features and functional annotations in HNSCC patients. (A) Circos plot illustrating the distribution of age, gender, smoking status, drinking status, and anatomical site between the RS and RR groups. (B) Stacked bar chart depicting the proportion of patients with different anatomical sites between these two groups. (C) Plot showcasing the top 10 enriched GO terms associated with DEGs in the BP, CC and MF categories. (D) Heatmap visualizing the enrichment scores of the top differentially enriched hallmark pathways between the RS and RR groups.
Fig. 3
Fig. 3
Interplay between radiosensitivity model and genomic characteristics in HNSCC patients. (A) Waterfall plots illustrating the top 20 most frequently mutated genes within both the RS and RR groups. (B) Kaplan-Meier curve showcasing the OS disparity between patients in the RR group with high TMB values compared to all other patient groups. (C) Kaplan-Meier survival curves depicting OS differences between patients in the RR group with high HRD scores and all other patient subgroups. (D) Scatter plot visualizing the distribution of mRNAsi scores across the RS and RR groups. (E) Kaplan-Meier survival curves demonstrating OS comparisons between patients in the RS group displaying high mRNAsi scores and all other patient subgroups.
Fig. 4
Fig. 4
Characterization of the tumor immune microenvironment in RS and RR groups based on ESTIMATE algorithm. (A) Violin plots illustrating the distribution of ESTIMATE scores, stromal scores, immune scores, and tumor purity, between the RS and RR groups. (B) Bar chart depicting the enrichment scores of immune-related functions and pathways in the RS and RR groups. (C) Lollipop plot showcasing the correlation between three genes comprising the radiosensitivity model and the enrichment scores of immune-related functions and pathways. (D) Stacked histogram visualizing the proportions of patients classified as high-immunity or low-immunity within the RS and RR groups. (E) Correlation analysis demonstrating the relationships between three radiosensitivity model genes and the expression levels of immunoinhibitor-related, immunostimulatory-related, and MHC-related genes. * p < 0.05, ** p < 0.01, *** p < 0.001.
Fig. 5
Fig. 5
Immune cell infiltration patterns between RS and RR groups based on CIBERSORT algorithm. (A) Bar chart illustrating the relative abundance of 22 distinct immune cell types within the RS and RR groups, as determined by CIBERSORT analysis. (B) Bubble map visualizing the pearson correlation coefficients between the expression levels of the three genes comprising the radiosensitivity model and the infiltration levels of 22 immune cell types. (C) Comparative analysis of CD8 T cell infiltration levels across the RS and RR groups, as assessed by four independent algorithms: XCELL, TIMER, QUANTISEQ, and MCPCOUNTER. (D) Kaplan-Meier survival curves demonstrating the prognostic significance of CD8 T cell infiltration in radiotherapy patients. *p < 0.05, **p < 0.01, ***p < 0.001.
Fig. 6
Fig. 6
Predicted differential sensitivity to immunotherapy, chemotherapy, and targeted therapy based on TIDE and pRRophetic algorithms. (A) Comparative analysis of the expression levels of key immune checkpoint genes between the RS and RR groups. (B) Violin plots illustrating the distribution of TIDE scores and T cell exclusion scores within the RS and RR groups. (C) Stacked bar chart depicting the proportion of patients classified as responders or non-responders to immunotherapy within each risk group. (D) Boxplots showcasing the IC50 values for conventional first-line chemotherapeutic agents (paclitaxel, docetaxel, and cisplatin) in the RS and RR groups. (E) Boxplots comparing the IC50 values for EGFR/HER2 inhibitors and PARP kinase inhibitors between the RS and RR groups. *p < 0.05, **p < 0.01, ***p < 0.001.
Fig. 7
Fig. 7
Integration of radiosensitivity and PD-L1 status for enhanced prognostication in HNSCC. (A) Kaplan-Meier survival curves depicting differences in OS between the RS-PD-L1-high subgroup and all other patient subgroups. (B) Comparative analysis of the proportions of 22 distinct immune cell infiltrates between the RS-PD-L1-high subgroup and all other subgroups. (C) Violin plots illustrating the distribution of IPS scores, predicting response to CTLA-4 and PD-1 inhibitors. (D) Stacked bar chart visualizing the proportion of patients classified as responders or non-responders to immunotherapy within the RS-PD-L1-high subgroup and other subgroups. *p < 0.05, **p < 0.01, ***p < 0.001.
Fig. 8
Fig. 8
In vitro validation of the chemokine-based radiosensitivity model. (A) Differential expression of CXCL2, and CCL28 between complete response and post-treatment failure patients in the GSE40020 cohort. (B) Cell viability of CAL-27 and CAL-27/IR cells after exposure to varying doses of radiation, as assessed by CCK8 assay. (C) Expression levels of CXCL2, CCL28, and CCR8 in CAL-27 and CAL-27IR cells 24 h after in vitro irradiation. * p < 0.05, *** p < 0.001.

Similar articles

References

    1. Siegel, R. L., Giaquinto, A. N., Jemal, A. & Cancer statistics CA: a cancer journal for clinicians 74, 12–49 (2024). (2024). 10.3322/caac.21820 - PubMed
    1. Bhatia, A. & Burtness, B. Treating head and neck cancer in the age of immunotherapy: A 2023 update. Drugs83, 217–248. 10.1007/s40265-023-01835-2 (2023). - PubMed
    1. Johnson, D. E. et al. Head and neck squamous cell carcinoma. Nat. Reviews Disease Primers. 6, 92. 10.1038/s41572-020-00224-3 (2020). - PMC - PubMed
    1. Tang, E. et al. Treatment strategy for distant synchronous metastatic head and neck squamous cell carcinoma. Curr. Oncol. Rep.21, 102. 10.1007/s11912-019-0856-5 (2019). - PubMed
    1. Hutchinson, M. N. D., Mierzwa, M. & D’Silva, N. J. Radiation resistance in head and neck squamous cell carcinoma: dire need for an appropriate sensitizer. Oncogene39, 3638–3649. 10.1038/s41388-020-1250-3 (2020). - PMC - PubMed

MeSH terms