

Set configuration influences cardiovascular responses to resistance exercise in postmenopausal females in a randomized crossover trial from the CARE project
- PMID: 40760080
- PMCID: PMC12322127
- DOI: 10.1038/s41598-025-14379-0
Set configuration influences cardiovascular responses to resistance exercise in postmenopausal females in a randomized crossover trial from the CARE project
Abstract
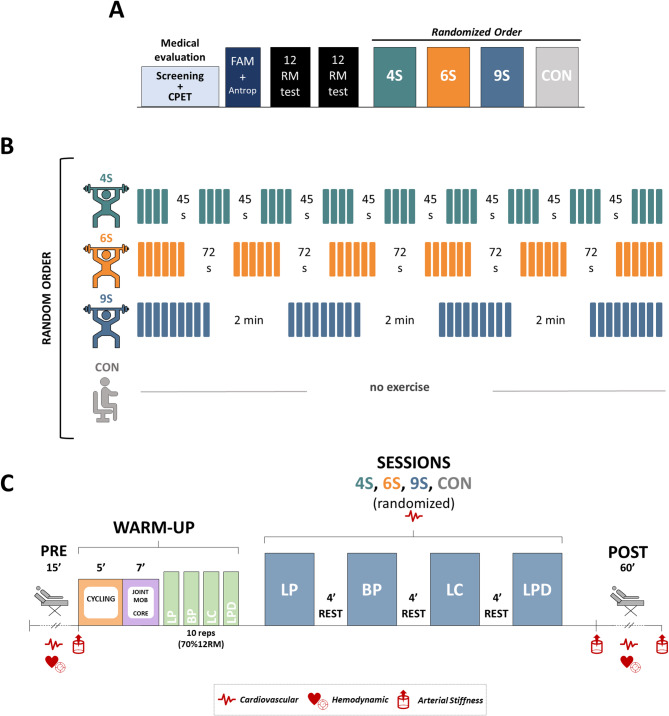
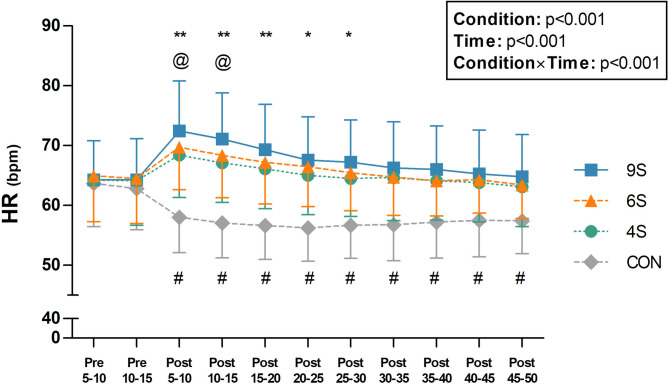
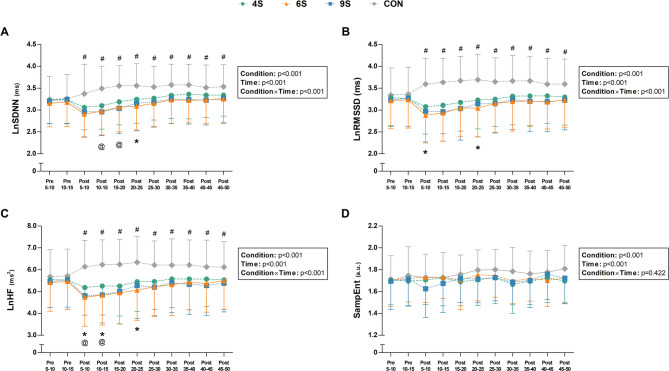
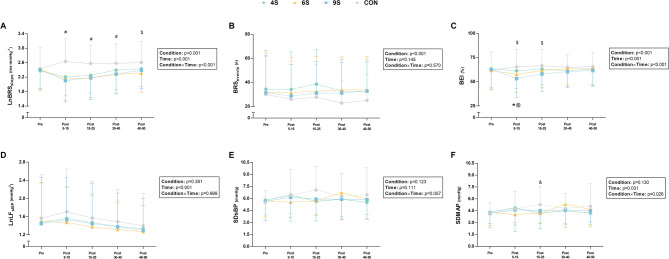
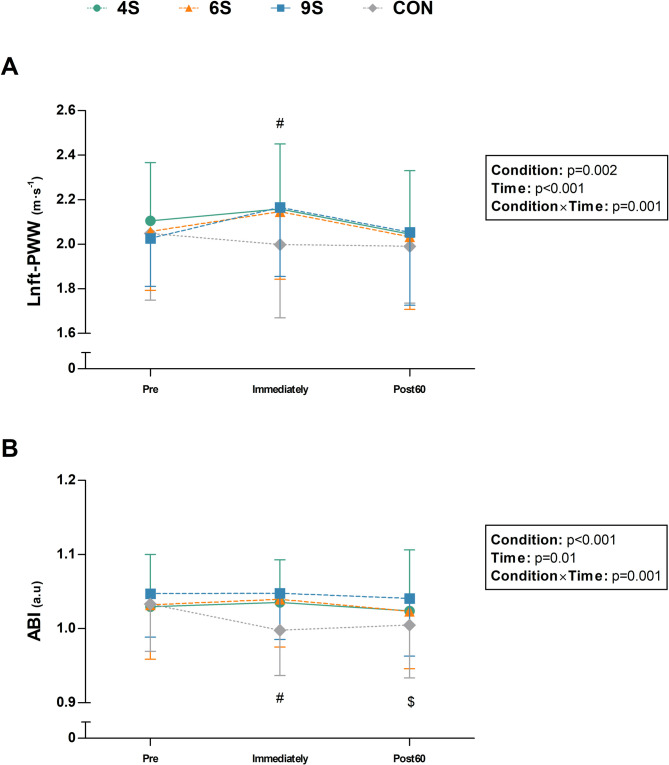
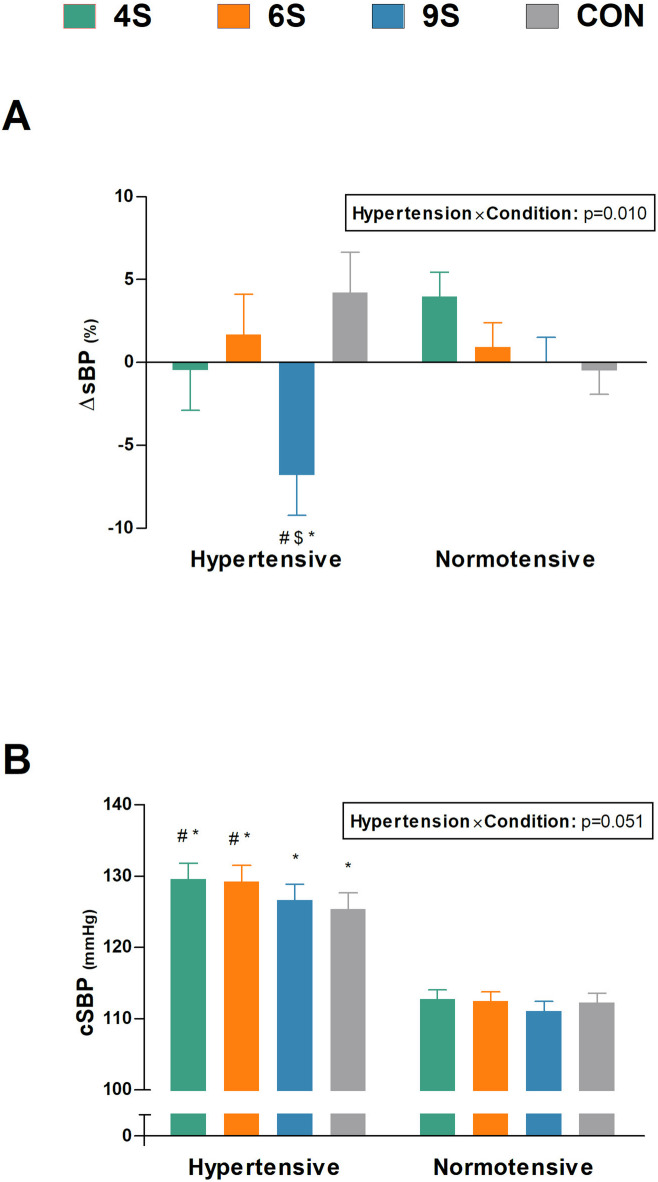
This study evaluated the acute cardiovascular responses to resistance exercise (RE) sessions with different set configurations in normotensive and hypertensive postmenopausal females. 50 physically active postmenopausal females performed a control (CON) and three RE sessions matched for total volume (144 repetitions), load (12-repetition maximum load), and total rest time (360s) but differing in set configuration: 4 sets of 9 repetitions with 120 s rest (9 S); 6 sets of 6 repetitions with 72 s rest (6 S); and 9 sets of 4 repetitions with 45 s rest (4 S). Heart rate (HR) was recorded during exercise, while HR variability, baroreflex sensitivity, arterial stiffness, and blood pressure were assessed before and after each session. Peak and mean HR values were higher during exercise in 9 S (p ≤ 0.026). All RE protocols induced cardiac parasympathetic withdrawal, reduction in baroreflex sensitivity, and increased post-exercise arterial stiffness compared to CON. However, in 4 S, cardiac parasympathetic withdrawal and baroreflex impairment were attenuated without a significant increase in arterial stiffness. Additionally, a post-exercise hypotensive response was observed only after 9 S in hypertensive participants (p = 0.004). Shorter set configurations attenuate chronotropic response during RE and mitigate impairments in cardiac autonomic and baroreflex control following RE sessions, without affecting arterial stiffness or blood pressure.
Keywords: Cardiovascular health; Climacteric; Cluster sets; Hemodynamics; Postmenopausal women; Strength training.
© 2025. The Author(s).
Conflict of interest statement
Declarations. Competing interests: The authors declare no competing interests.
Figures
References
-
- Maltais, M. L., Desroches, J. & Dionne, I. J. Changes in muscle mass and strength after menopause. J. Musculoskelet. Neuronal Interact.9, 186–197 (2009). - PubMed
-
- Vogel, B. et al. The lancet women and cardiovascular disease commission: reducing the global burden by 2030. Lancet397, 2385–2438 (2021). - PubMed
-
- Messier, V. et al. Menopause and sarcopenia: A potential role for sex hormones. Maturitas68, 331–336 (2011). - PubMed
-
- de Villiers, T. J. Bone health and menopause: osteoporosis prevention and treatment. Best Pract. Res. Clin. Endocrinol. Metab.38, 101782 (2024). - PubMed
Publication types
MeSH terms
Grants and funding
- PID2021-124277OB-I00/MCIN/AEI/ 10.13039/501100011033 and "ERDF/EU
- PID2021-124277OB-I00/MCIN/AEI/ 10.13039/501100011033 and "ERDF/EU
- PID2021-124277OB-I00/MCIN/AEI/ 10.13039/501100011033 and "ERDF/EU
- PID2021-124277OB-I00/MCIN/AEI/ 10.13039/501100011033 and "ERDF/EU
- PID2021-124277OB-I00/MCIN/AEI/ 10.13039/501100011033 and "ERDF/EU
- PID2021-124277OB-I00/MCIN/AEI/ 10.13039/501100011033 and "ERDF/EU
- PID2021-124277OB-I00/MCIN/AEI/ 10.13039/501100011033 and "ERDF/EU
- RSUC.UDC.MS09/Spanish Ministry of Universities through the Grants for the Requalification of the Spanish University System under the Postdoctoral Margarita Salas Programme
- RSUC.UDC.MS10/Spanish Ministry of Universities through the Grants for the Requalification of the Spanish University System under the Postdoctoral Margarita Salas Programme
- ED481B-2024-077/Xunta de Galicia (Consellería de Cultura, Educación, Formación Profesional y Universidades) through the Xunta de Galicia Postdoctoral Fellowships
- FPU23/03727/Spanish Ministry of Science, Innovation and Universities
LinkOut - more resources
Full Text Sources
