. 2025 Aug 4;8(1):1152.
doi: 10.1038/s42003-025-08620-9.

AgRP neuron activity enhances reward-related consummatory behaviors during energy deficit in mice

Affiliations

AgRP neuron activity enhances reward-related consummatory behaviors during energy deficit in mice

Daniela A Cassano et al. Commun Biol. .

Abstract

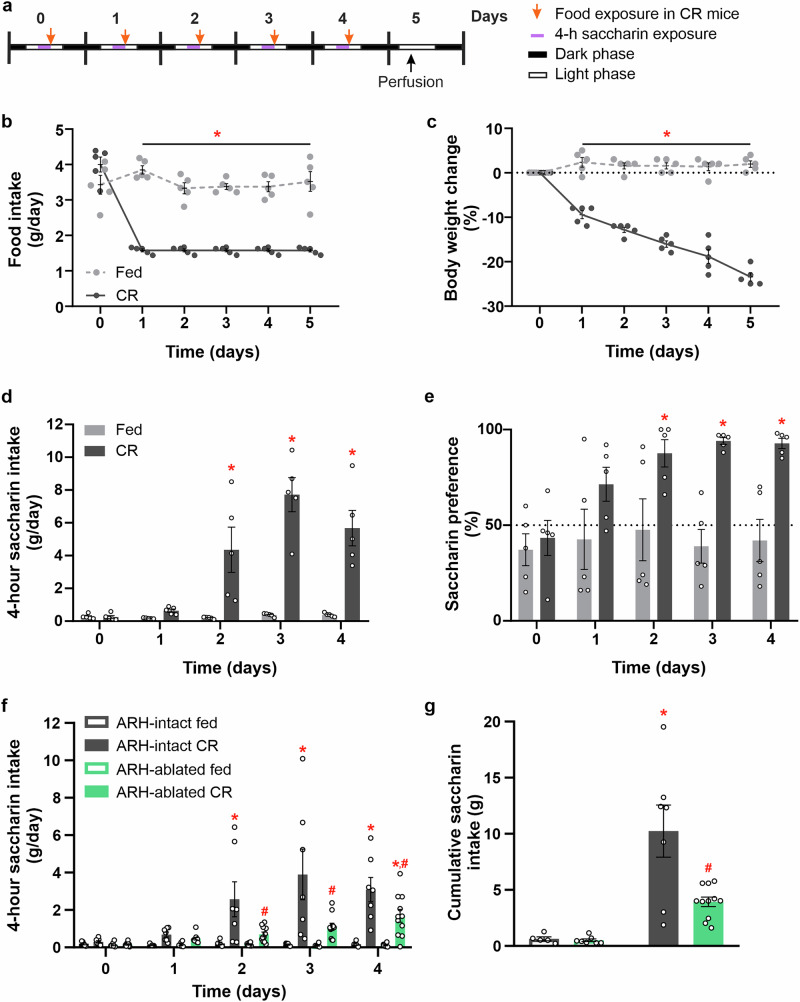
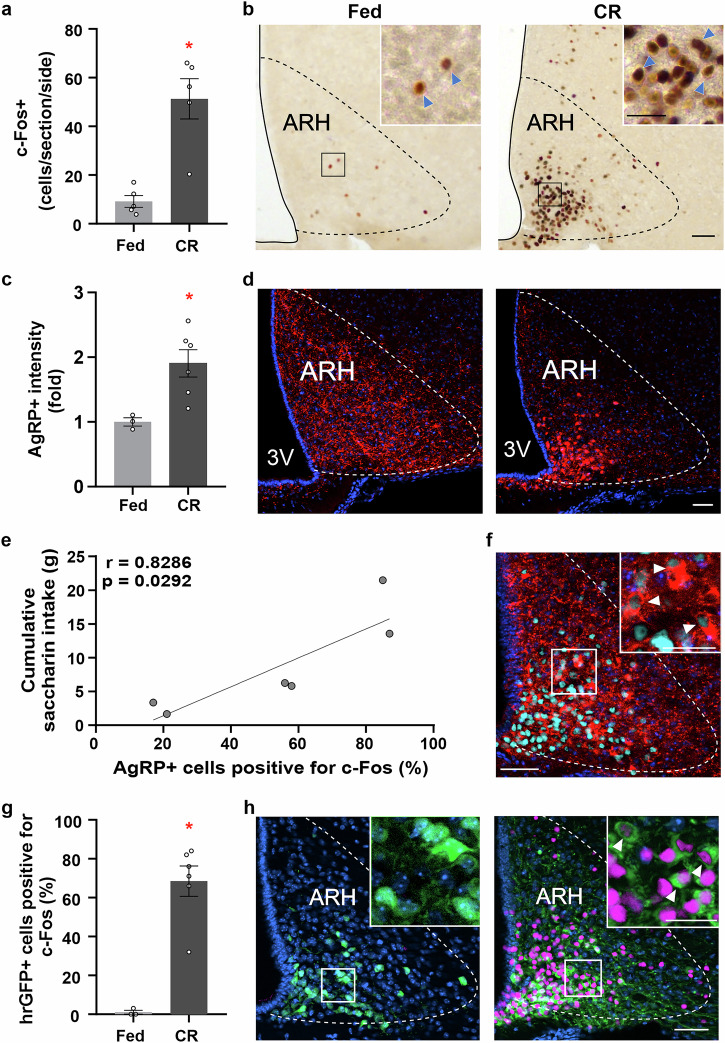
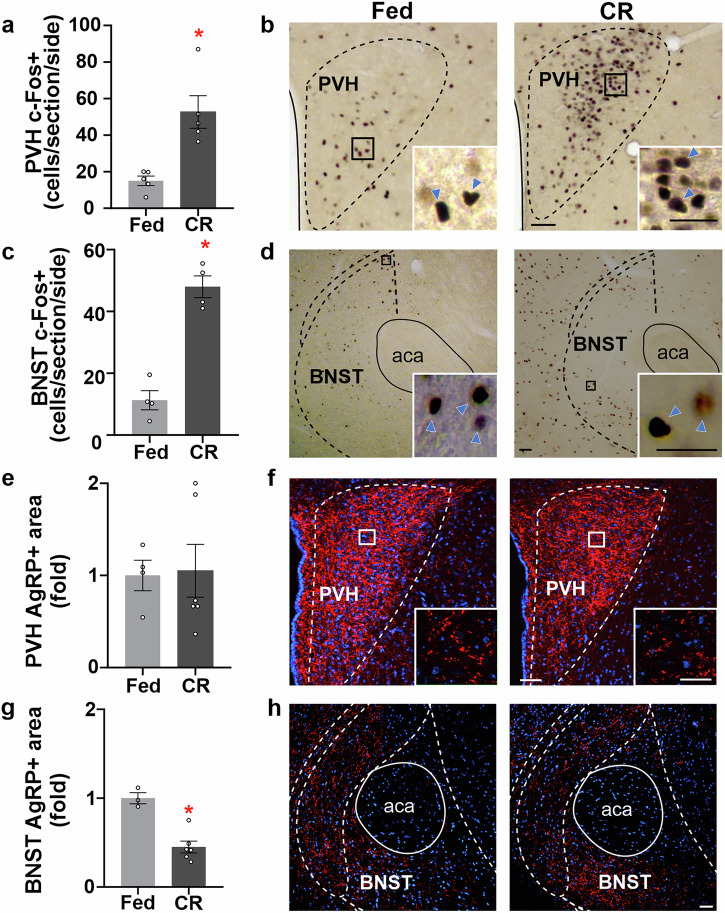
Hunger enhances the consumption of rewarding foods, but the neurobiological basis of this adaptation remains unclear. We hypothesize that agouti-related protein (AgRP) neurons in the hypothalamic arcuate nucleus (ARH) promote the consumption of rewarding stimuli under calorie restriction, independent of caloric content. To test this, we study mice fed 40% of their average daily intake and exposed daily to the non-caloric sweetener saccharin before feeding. We show that calorie-restricted (CR) mice increase saccharin intake before each restricted feeding event and that this response requires ARH integrity. CR mice exhibit activation of AgRP neurons and their brain targets without significant changes in AgRP fiber density. Furthermore, satiated mice increase saccharin intake following chemogenetic activation of AgRP neurons, whereas CR mice with selective chemogenetic inhibition of AgRP neurons show reduced saccharin intake. Thus, we conclude that AgRP neuron activation enhances the consumption of a purely rewarding stimulus in CR mice. These findings contribute to our understanding of how the brain shapes food choices under conditions of energy deficit and could be important for managing food consumption during dieting or in eating disorders.


Conflict of interest statement

Competing interests: The authors declare no competing interests. Ethics approval: All experiments received approval from the Institutional Animal Care and Use Committees of the IMBICE (21-0430 A) and the Federal University of São Paulo (12/2017). Consent to publish and consent to participate: The study does not involve human subjects and the manuscript contains any individual person’s data in any form.

Figures

Fig. 1
Fig. 1. The integrity of the ARH is required for the enhancement of saccharin intake induced by calorie restriction.
a The experimental timeline summarizes the design used in the current study. Male mice were calorie restricted to 40% of their basal intake for 5 days and had restricted access to a saccharin solution (0.1%) for 4 h every day while water was ad libitum available. During the limited access period, chow was removed from home cages. Mice were perfused on day 5, prior to any access to saccharin or food. be Show food intake (b, p-time x group < 0.001, Cohen’s f = 1.984), body weight change, (c, p-time x group < 0.001, Cohen’s f = 3.084), saccharin intake (d, p-time x group < 0.001, Cohen’s f = 1.49) and saccharin preference (e, p-time x group < 0.001, Cohen’s f = 1.013), of wild-type (WT) mice that were maintained with ad libitum access to regular chow or calorie restricted (CR) for 5 days (n = 5 mice per group). fg Show saccharin intake (f, p-time x treatment = 0.060, Cohen’s f = 0.341; p-time x group < 0.001, Cohen’s f = 0.724; p-treatment x group = 0.0146, Cohen’s f = 0.464; p-time x treatment x group = 0.070, Cohen’s f = 0.334) and cumulative saccharin intake (g, p-group x treatment = 0.015, Cohen’s f = 0.515) of WT ARH-intact or ARH-ablated mice that were maintained with ad libitum access to regular chow (n = 5 and 7 mice per group) or CR (n = 7 and 11 mice per group). Data represent the mean ± SEM, with error bars representing the SEM, and were compared by two-way ANOVA (be, g) or three-way ANOVA (f). *, p < 0.05 vs. same treatment different group; #, p < 0.05 different treatment same group.
Fig. 2
Fig. 2. AgRP neurons are activated during calorie restriction.
a Bar graph displaying the quantitative analysis of the number of c-Fos+ cells in the hypothalamic arcuate nucleus (ARH) of wild-type (WT) mice ad libitum fed or calorie restricted (CR) (n = 5 mice per group, p = 0.005, Cohen’s d = 2.267). b Representative photomicrographs of the coronal section of ARH subjected to chromogenic immunohistochemistry against c-Fos (brown). c Bar graphs displaying the quantitative analysis of the mean fluorescence intensity of AgRP+ in the ARH of WT mice ad libitum fed or CR (n = 4 and 6 mice per group, p = 0.023, Cohen’s d = 1.10). d Representative photomicrographs of coronal section of ARH subjected to fluorescent immunohistochemistry against AgRP (red). e Pearson correlation between cumulative saccharin intake and AgRP cells positive for c-Fos (%) in CR mice (n = 6 mice). f Representative photomicrographs of the coronal section of the ARH of WT mice subjected to chromogenic immunohistochemistry against c-Fos (cyan) and fluorescent immunohistochemistry against AgRP (red). g Bar graphs displaying the quantitative analysis of the hrGFP+ cells positive for c-Fos (%) in the ARH of NPY-hrGFP mice that were maintained with ad libitum access to regular chow or CR for 5 days (n = 3 and 6 mice per group, p = 0.024, Cohen’s d = 4.97). h Representative photomicrographs of the coronal section of ARH of NPY-hrGFP mice subjected to chromogenic immunohistochemistry against c-Fos (magenta) and fluorescent immunohistochemistry against hr-GFP (green). Colocalization is shown with white arrowheads and c-Fos+ signal with blue arrowheads. Scale bar: 50 µm low magnification and 25 µm high magnification. Data represent the mean ± SEM, with error bars representing the SEM, and were compared by t-test. *, p < 0.05 vs. ad libitum fed.
Fig. 3
Fig. 3. Calorie restriction induces c-Fos expression in AgRP neuronal targets.
a, c Bar graph displaying the quantitative analysis of the number of c-Fos+ cells in the paraventricular hypothalamic nucleus (PVH; p = 0.011, Cohen’s d = 0.99) and bed nucleus of the stria terminalis (BNST; p < 0.001, Cohen’s d = 3.22), respectively, of wild-type (WT) mice ad libitum fed (n = 5 and 4 mice per group) or calorie restricted (CR) (n = 5 and 4 mice per group). b, d Representative photomicrographs of the coronal section of PVH and BNST, respectively, subjected to chromogenic immunohistochemistry against c-Fos (brown signal, blue head arrows). e, g Bar graph displaying the quantitative analysis of the fluorescent area in the PVH (p = 0.801) and BNST (p = 0.0013, Cohen’s d = 3.92), respectively, of WT mice ad libitum fed or CR (n = 4 and 6 mice per group). f, h Representative photomicrographs of the coronal section of PVH and BNST, respectively, of WT mice subjected to fluorescent immunohistochemistry against AgRP (red). Scale Bar: 50 µm low magnification and 25 µm high magnification. Data represent the mean ± SEM, with error bars representing the SEM. Data were compared by t-test. *, p < 0.05 vs. ad libitum fed. aca, anterior commissure, anterior part.
Fig. 4
Fig. 4. AgRP neurons are required for the enhanced saccharin intake during calorie restriction.
a Representative photomicrographs of coronal section of hypothalamic arcuate nucleus (ARH) of wild-type (WT) or AgRP-Cre mice stereotaxically injected with pAAV8-hSyn-DIO-hM3D(Gq)-mCherry (red). Mice were perfused after CNO treatment and brain sections were subjected to a fluorescent immunohistochemistry against c-Fos (green). b Bar graphs display saccharin intake for 4 h after vehicle or CNO treatment 30 min before access to saccharin solution in AgRP-Gq mice in a crossover protocol (n = 5 mice per group, paired t-test, p = 0.029, Cohen’s d = 1.21). c Displays body weight change of CR AgRP-Gi mice treated with vehicle or CNO (n = 11 and 9 mice per group, two-way ANOVA, p-time x treatment = 0.413; p-treatment = 0.515; p-time < 0.001, Cohen’s f = 3.96). d Shows saccharin intake of CR AgRP-Gi mice that were treated with vehicle or CNO before saccharin exposure (n = 9 and 8 mice per group; two-way ANOVA: p-time x treatment = 0.703; p-treatment = 0.263; p-time < 0.001; Cohen’s f = 1.183. Dunnett’s post hoc tests: days 1, 2, 3, and 4 vs. day 0 in the vehicle-treated group: p = 0.203, 0.030, 0.006, and 0.036; in the CNO-treated group: p = 0.994, 0.999, 0.042, and 0.010. Vehicle- vs. CNO-treated groups: t-test on day 1, p = 0.165; day 2, p = 0.003, Cohen’s d = 1.55; day 3; p = 0.028, Cohen’s d = 1.02; and day 4, p = 0.0.466). e Bar graph displaying the latency to eat in vehicle- or CNO-treated AgRP-Gi mice (n = 4 and 5 mice per group; two-way ANOVA: p-time × treatment = 0.008, Cohen’s f = 0.861; Sidak’s post hoc test: vehicle- vs. CNO-treated AgRP-Gi mice on day 2, p = 0.004). f Bar graph displaying 1-hour food intake after saccharin exposure in vehicle- or CNO-treated AgRP-Gi mice (n = 7 and 6 mice per group; t-test: day 1, p = 0.065; day 2, p = 0.027, Cohen’s d = 1.46; day 3, p = 0.0.282; and day 4, p = 0.276). g Representative photomicrographs of coronal section of ARH of AgRP-Gi mice treated with vehicle or CNO subjected to chromogenic immunohistochemistry against c-Fos (cyan) and fluorescent immunohistochemistry against AgRP (red). Colocalization is shown with white arrowheads. h Representative photomicrographs of coronal section of paraventricular hypothalamic nucleus (PVH) of AgRP-Gi mice treated with vehicle or CNO subjected to chromogenic immunohistochemistry against c-Fos (brown signal, blue arrowheads). Scale Bar: 50 µm low magnification and 25 µm high magnification. Data represent the mean ± SEM, with error bars representing the SEM. *, p < 0.05; †, p < 0.1 vs. different treatment; a, p < 0.05 vs day 0 same treatment.

References

    1. Lockie, S. H. & Andrews, Z. B. The hormonal signature of energy deficit: increasing the value of food reward. Mol. Metab.2, 329–336 (2013). - PMC - PubMed
    1. Aponte, Y., Atasoy, D. & Sternson, S. M. AGRP neurons are sufficient to orchestrate feeding behavior rapidly and without training. Nat. Neurosci.14, 351–355 (2011). - PMC - PubMed
    1. Krashes, M. J. et al. Rapid, reversible activation of AgRP neurons drives feeding behavior in mice. J. Clin. Investig.121, 1424–1428 (2011). - PMC - PubMed
    1. Cai, J. et al. AgRP neurons are not indispensable for body weight maintenance in adult mice. Cell Rep.42, 112789 (2023). - PMC - PubMed
    1. Luquet, S., Perez, F. A., Hnasko, T. S. & Palmiter, R. D. NPY/AgRP neurons are essential for feeding in adult mice but can be ablated in neonates. Science310, 683–685 (2005). - PubMed