

Diagnostic systematic review and meta-analysis of machine learning in predicting biochemical recurrence of prostate cancer
- PMID: 40760134
- PMCID: PMC12321981
- DOI: 10.1038/s41598-025-11445-5
Diagnostic systematic review and meta-analysis of machine learning in predicting biochemical recurrence of prostate cancer
Abstract
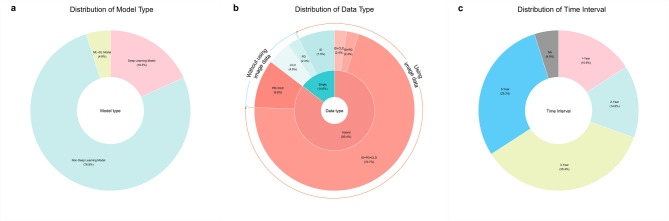
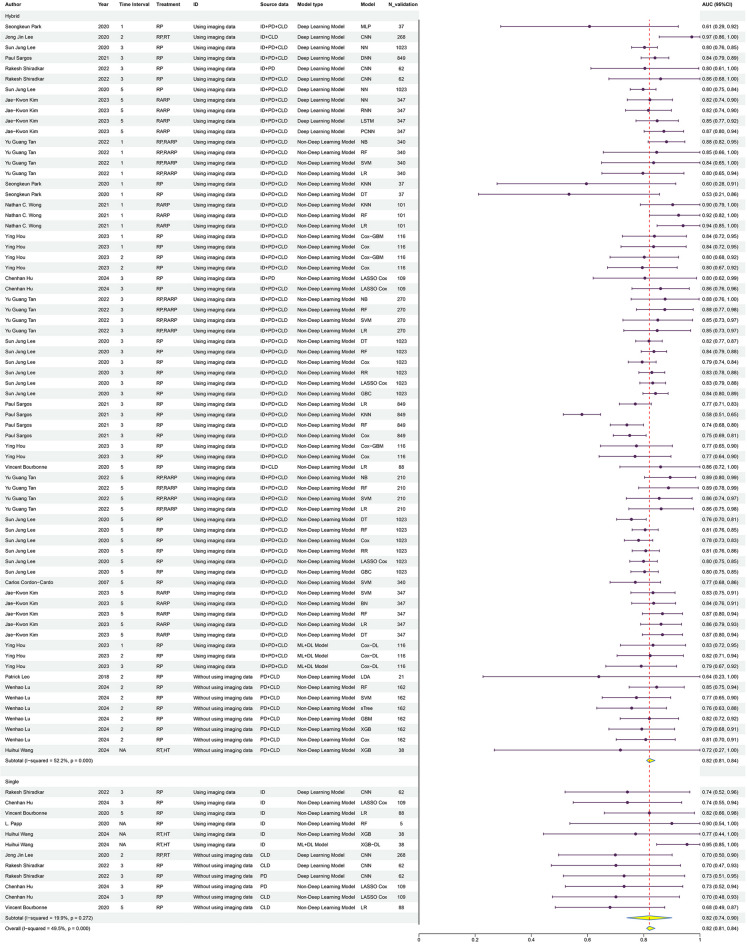
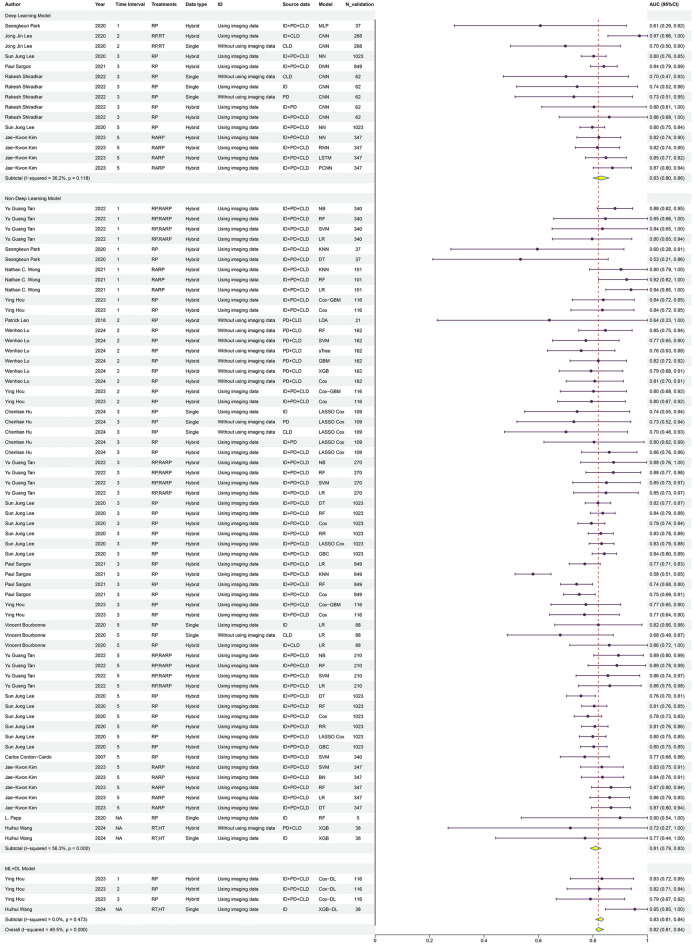
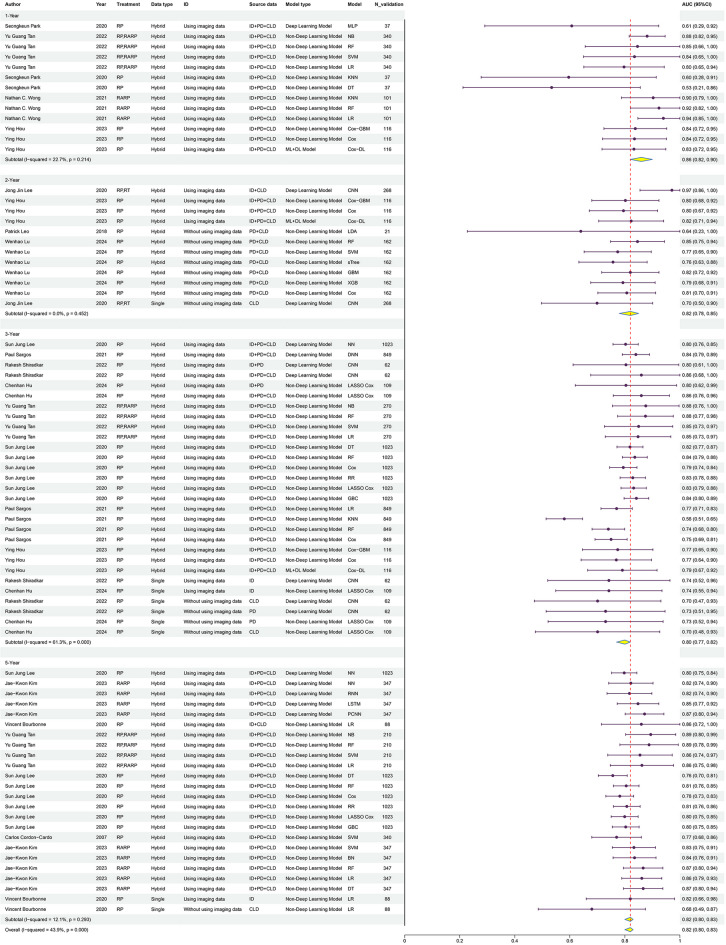
Prostate cancer (PCa) is the most prevalent malignant tumor in males, and many patients remain at risk of biochemical recurrence (BCR) following initial treatment. Accurate prediction of BCR is vital for effective clinical management and treatment planning. This study evaluates the effectiveness of machine learning (ML) models in predicting BCR among prostate cancer patients, comparing their performance to traditional prognostic methods. We systematically searched four databases (PubMed, Web of Science, Embase, and Cochrane) for studies employing ML techniques to predict prostate cancer BCR. Data extraction included model type, sample size, and the area under the curve (AUC). A meta-analysis was conducted using AUC as the primary performance metric to assess predictive accuracy and heterogeneity across models. Sixteen studies comprising a total of 17,316 prostate cancer patients were included. The pooled AUC for ML models was 0.82 (95% CI: 0.81-0.84). Deep learning and hybrid models outperformed traditional models (AUC = 0.83). Models using imaging data showed improved performance (AUC = 0.82). ML models were most effective in predicting 1-year BCR (AUC = 0.86), with performance slightly decreasing for longer time intervals. ML models outperform traditional methods in predicting BCR, especially in the short term. Incorporating multimodal data, such as imaging, enhances predictive accuracy. Future studies should optimize and validate these models through large-scale clinical trials.
© 2025. The Author(s).
Conflict of interest statement
Declarations. Competing interests: The authors declare no competing interests. Consent for publication: We agree to the publication of our research paper by the publisher.
Figures


References
-
- Bray, F. et al. Global cancer statistics 2022: GLOBOCAN estimates of incidence and mortality worldwide for 36 cancers in 185 countries. CA Cancer J. Clin.74, 229–263. 10.3322/caac.21834 (2024). - PubMed
-
- Budäus, L. et al. Defining biochemical recurrence after radical prostatectomy and timing of early salvage radiotherapy: informing the debate. Strahlenther Onkol. 193, 692–699. 10.1007/s00066-017-1140-y (2017). - PubMed
Publication types
MeSH terms
Grants and funding
- 82360476/National Natural Science Foundation of China
- 82360476/National Natural Science Foundation of China
- 82360476/National Natural Science Foundation of China
- 82360476/National Natural Science Foundation of China
- 82360476/National Natural Science Foundation of China
- 82360476/National Natural Science Foundation of China
- 82360476/National Natural Science Foundation of China
- 82360476/National Natural Science Foundation of China
- 82360476/National Natural Science Foundation of China
- 2022D01D39/The Key Projects of Xinjiang Uyghur Autonomous Region
- 2022D01D39/The Key Projects of Xinjiang Uyghur Autonomous Region
- 2022D01D39/The Key Projects of Xinjiang Uyghur Autonomous Region
- 2022D01D39/The Key Projects of Xinjiang Uyghur Autonomous Region
- 2022D01D39/The Key Projects of Xinjiang Uyghur Autonomous Region
- 2022D01D39/The Key Projects of Xinjiang Uyghur Autonomous Region
- 2022D01D39/The Key Projects of Xinjiang Uyghur Autonomous Region
- 2022D01D39/The Key Projects of Xinjiang Uyghur Autonomous Region
- 2022D01D39/The Key Projects of Xinjiang Uyghur Autonomous Region
- 2024E02054/The Regional Collaborative Innovation Special Project of the Autonomous Region, Science and Technology Support Program for Xinjiang
- 2024E02054/The Regional Collaborative Innovation Special Project of the Autonomous Region, Science and Technology Support Program for Xinjiang
- 2024E02054/The Regional Collaborative Innovation Special Project of the Autonomous Region, Science and Technology Support Program for Xinjiang
- 2024E02054/The Regional Collaborative Innovation Special Project of the Autonomous Region, Science and Technology Support Program for Xinjiang
- 2024E02054/The Regional Collaborative Innovation Special Project of the Autonomous Region, Science and Technology Support Program for Xinjiang
- 2024E02054/The Regional Collaborative Innovation Special Project of the Autonomous Region, Science and Technology Support Program for Xinjiang
- 2024E02054/The Regional Collaborative Innovation Special Project of the Autonomous Region, Science and Technology Support Program for Xinjiang
- 2024E02054/The Regional Collaborative Innovation Special Project of the Autonomous Region, Science and Technology Support Program for Xinjiang
- 2024E02054/The Regional Collaborative Innovation Special Project of the Autonomous Region, Science and Technology Support Program for Xinjiang
- 2022D01C782/The Natural Science Foundation of Xinjiang Uygur Autonomous Region
- 2022D01C782/The Natural Science Foundation of Xinjiang Uygur Autonomous Region
- 2022D01C782/The Natural Science Foundation of Xinjiang Uygur Autonomous Region
- 2022D01C782/The Natural Science Foundation of Xinjiang Uygur Autonomous Region
- 2022D01C782/The Natural Science Foundation of Xinjiang Uygur Autonomous Region
- 2022D01C782/The Natural Science Foundation of Xinjiang Uygur Autonomous Region
- 2022D01C782/The Natural Science Foundation of Xinjiang Uygur Autonomous Region
- 2022D01C782/The Natural Science Foundation of Xinjiang Uygur Autonomous Region
- 2022D01C782/The Natural Science Foundation of Xinjiang Uygur Autonomous Region
LinkOut - more resources
Full Text Sources
Medical
