

Effect of repeated sprint exercise on immunological responses in adult and adolescent athletes at different stages of biological maturation: a-quasi-experimental-trial
- PMID: 40760148
- PMCID: PMC12322109
- DOI: 10.1038/s41598-025-13515-0
Effect of repeated sprint exercise on immunological responses in adult and adolescent athletes at different stages of biological maturation: a-quasi-experimental-trial
Abstract
Repeated sprint exercise (RSE), widely used in intermittent sports, induces immune changes critical to address for optimizing training and reducing health risks in youth athletes, especially across biological maturation (BM) stages. We analyzed RSE effects on immune factors in adolescent and adult athletes, considering BM stages. Twenty-nine male intermittent-sport athletes (19 hebiatric: 10 pre-peak height velocity [PHV] [12.1 ± 0.6 years], 9 circum-PHV [13.8 ± 0.7 years]; 10 adults [23.2 ± 2.1 years]) performed RSE (3 × 6 × 35 m sprints, 10-sec rest, 5 min interset). Blood was collected pre-, post-, 2 h, and 24 h post-RSE to assess lactate, leukocyte subsets (neutrophils, monocytes, lymphocytes, T/B cells, NK-cells), and cytokines. According to international guidelines for athletic classification, 72% of the participants in this study were classified as level 2 (regional; ~12-19% of the global population), 17% as level 3 (national; ~0.014% of the global population), and 11% as level 4 (international; ~0.0025% of the global population). RSE elevated leukocytes in all groups, with adults showing higher neutrophils and hebiatric athletes elevated T/B cells (p < 0.05). Pre-PHV exhibited reduced neutrophil/cytokine responses versus circum-PHV/adults (p < 0.05). Circum-PHV displayed post-RSE CD4+/CD8 + rises, while adults had the lowest CD4+ (p < 0.05). Pre-PHV peaked in NK/B-cells at 2 h/24 h; adults showed elevated IL-6/IL-8 (p < 0.05). All parameters normalized by 24 h. Immune responses to RSE differ by BM stage, with adults exhibiting heightened inflammation. Tailoring training to BM stages may optimize performance and reduce immunosuppression risks, particularly in hebiatric athletes.
Keywords: Cytokine; Hematology; Leukocyte; Lymphocyte; Sport.
© 2025. The Author(s).
Conflict of interest statement
Declarations. Competing interests: The authors declare no competing interests. Ethical and register: The study received approval from the Ethics Committee of the Federal University of Rio Grande do Norte (#63337022.5.0000.5537) and is in compliance with the Declaration of Helsinki. This experimental trial was registered a priori on the Open Science Framework Registries platform on 25/07/2025 under the DOI: https://doi.org/10.17605/OSF.IO/SCB2G . Fulfilling the criteria of the International Committee of Medical Journal Editors (ICMJE).
Figures


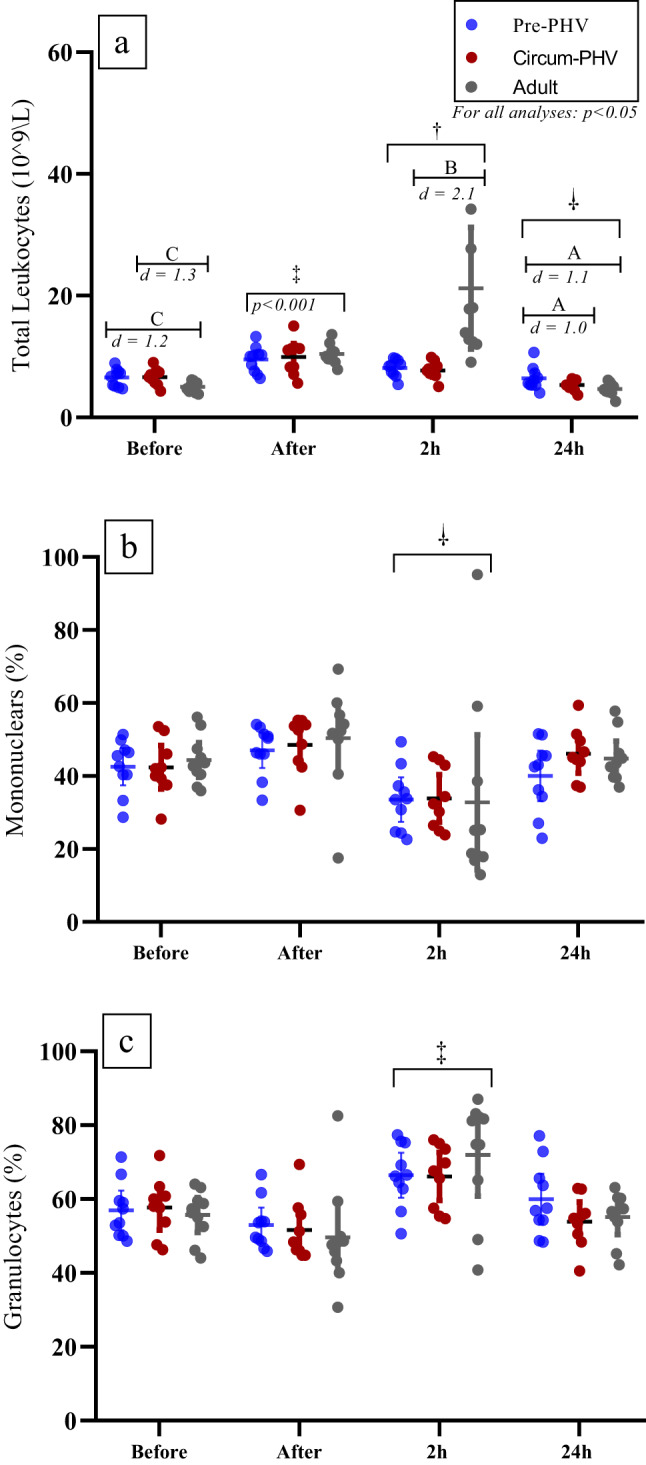
 : Lower than the other time points. †: Higher than the Before time point. A: Higher than the other groups. B: Higher than the circum-PHV group. C: Higher than the Adult group. Statistical analysis: Repeated measures ANOVA with Bonferroni post-hoc tests. d: Effect size by d-Cohen.
 : Lower than the other time points. †: Lower than the Before and After RSE time points. #: Lower than the Before and 2 h post RSE time points. A: Higher than the other groups. B: Lower than the other groups. C: Higher than the Before and 24 h post RSE time points. |---|: Differences between different time points. |-|: Differences between different groups, within the same time point. Statistical analysis: Repeated measures ANOVA with Bonferroni post-hoc tests. d: Effect size by d-Cohen.
 : Lower than the other time points. †: Lower than the Before and After RSE time points. A: Higher than the other groups. B: Lower than the other groups. |---|: Differences between different time points. |-|: Differences between different groups, within the same time point. Statistical analysis: Repeated measures ANOVA with Bonferroni post-hoc tests. d: Effect size by d-Cohen.
 : Lower than the other time points. A: Higher than the other groups. B: Lower than the other groups. H: Higher than the Before & 24 h post time points. I: Higher than the Before & 2 h post time points. J: Higher than the After-time points. |---|: Differences between different time points. |-|: Differences between different groups, within the same time point. Statistical analysis: Repeated measures ANOVA with Bonferroni post-hoc tests. d: Effect size by d-Cohen.
Similar articles
-
The Effects of Repeated-Sprint Training on Physical Fitness and Physiological Adaptation in Athletes: A Systematic Review and Meta-Analysis.Sports Med. 2024 Apr;54(4):953-974. doi: 10.1007/s40279-023-01959-1. Epub 2023 Dec 2. Sports Med. 2024. PMID: 38041768
-
The Influence of Maturity Status on Drop Jump Kinetics in Male Youth.J Strength Cond Res. 2024 Jan 1;38(1):38-46. doi: 10.1519/JSC.0000000000004569. J Strength Cond Res. 2024. PMID: 38085620
-
Knee orthoses for treating patellofemoral pain syndrome.Cochrane Database Syst Rev. 2015 Dec 8;2015(12):CD010513. doi: 10.1002/14651858.CD010513.pub2. Cochrane Database Syst Rev. 2015. PMID: 26645724 Free PMC article.
-
Falls prevention interventions for community-dwelling older adults: systematic review and meta-analysis of benefits, harms, and patient values and preferences.Syst Rev. 2024 Nov 26;13(1):289. doi: 10.1186/s13643-024-02681-3. Syst Rev. 2024. PMID: 39593159 Free PMC article.
-
Can Current Metrics Characterise or Differentiate Between Elite Track and Field Athletes Within the Sprints, Hurdles, High Jump, Long Jump and Triple Jump? A Systematic Review.Sports Med. 2025 Jul 28. doi: 10.1007/s40279-025-02284-5. Online ahead of print. Sports Med. 2025. PMID: 40721687
References
-
- Billat, L. V. Interval training for performance: a scientific and empirical practice: special recommendations for middle-and long-distance running. Part I: aerobic interval training. Sports Med.31, 13–31. 10.2165/00007256-200131010-00002 (2001). - PubMed
-
- Bishop, D., Girard, O. & Mendez-Villanueva, A. Repeated-sprint ability—part II: recommendations for training. Sports Med.41, 741–756. 10.2165/11590560-000000000-00000 (2011). - PubMed
-
- Thurlow, F. et al. The effects of repeated-sprint training on physical fitness and physiological adaptation in athletes: a systematic review and meta-analysis. Sports Med.53, 1955–1976. 10.1007/s40279-023-01959-1 (2023). - PubMed
-
- Peake, J. M., Neubauer, O., Walsh, N. P. & Simpson, R. J. Recovery of the immune system after exercise. J. Appl. Physiol.122, 1077–1087. 10.1152/japplphysiol.00622.2016 (2017). - PubMed
-
- Akkoç, O. et al. Acute effect of repeated sprint and aerobic endurance training on Foxp3 + regulatory T cells and cytokine levels. Turk. J. Immunol.910.5222/TJI.2021.95530 (2021).
MeSH terms
Substances
Grants and funding
LinkOut - more resources
Full Text Sources
Medical
Research Materials
