

Frequent longitudinal blood microsampling and proteome monitoring identify disease markers and enable timely intervention in a mouse model of type 1 diabetes
- PMID: 40760251
- PMCID: PMC12423192
- DOI: 10.1007/s00125-025-06502-7
Frequent longitudinal blood microsampling and proteome monitoring identify disease markers and enable timely intervention in a mouse model of type 1 diabetes
Abstract
Aims/hypothesis: Type 1 diabetes manifests after irreversible beta cell damage, highlighting the crucial need for markers of the presymptomatic phase to enable early and effective interventions. Current efforts to identify molecular markers of disease-triggering events lack resolution and convenience. Analysing frequently self-collected dried blood spots (DBS) could enable the detection of early disease-predictive markers and facilitate tailored interventions. Here, we present a novel strategy for monitoring transient molecular changes induced by environmental triggers that enable timely disease interception.
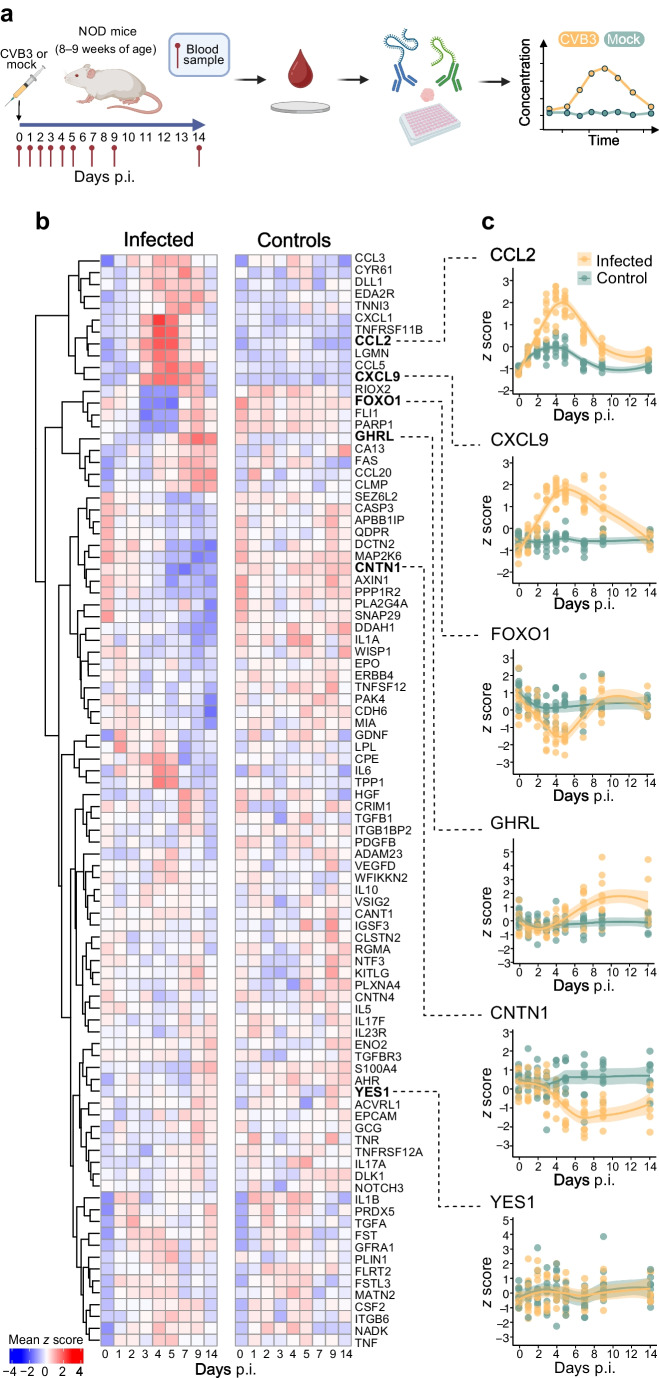
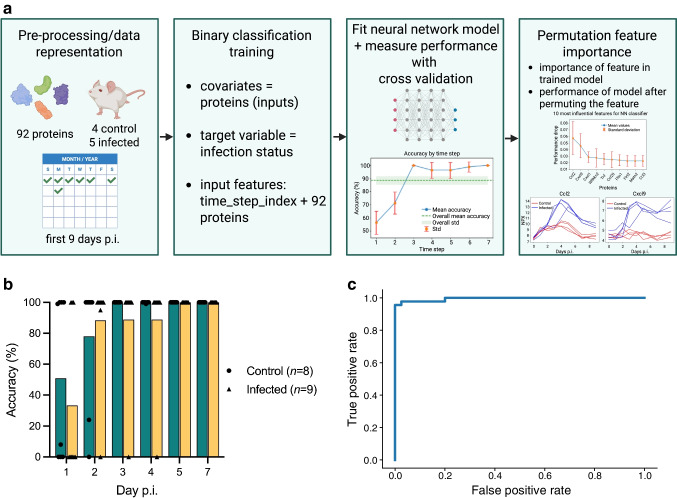
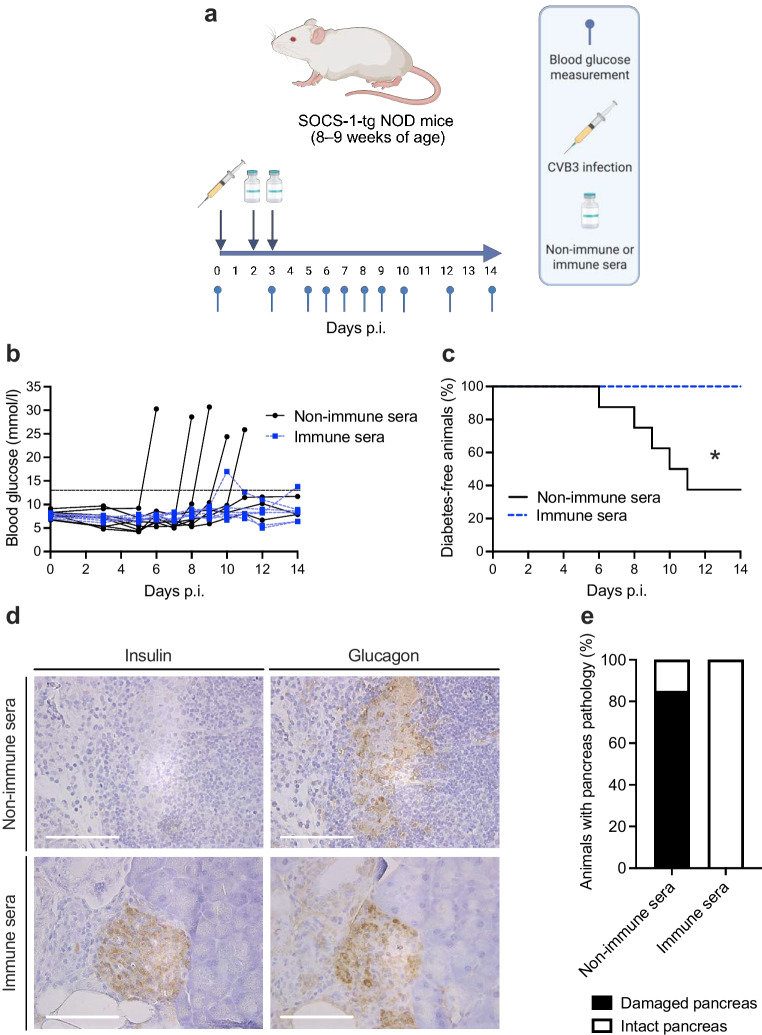
Methods: Whole blood (10 μl) was sampled regularly (every 1-5 days) from adult NOD mice infected with Coxsackievirus B3 (CVB3) or treated with vehicle alone. Blood samples (5 μl) were dried on filter discs. DBS samples were analysed by proximity extension assay. Generalised additive models were used to assess linear and non-linear relationships between protein levels and the number of days post infection (p.i.). A multi-layer perceptron (MLP) classifier was developed to predict infection status. CVB3-infected SOCS-1-transgenic (tg) mice were treated with immune- or non-immune sera on days 2 and 3 p.i., followed by monitoring of diabetes development.
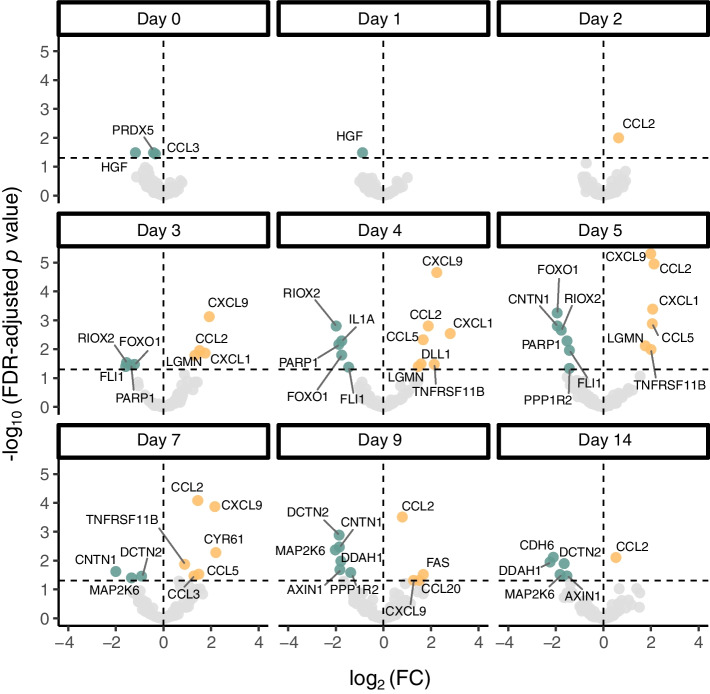
Results: Frequent blood sampling and longitudinal measurement of the blood proteome revealed transient molecular changes in virus-infected animals that would have been missed with less frequent sampling. The MLP classifier predicted infection status after day 2 p.i. with over 90% accuracy. Treatment with immune sera on day 2 p.i. prevented diabetes development in all (100%) of CVB3-infected SOCS-1-tg NOD mice while five out of eight (62.5%) of the CVB3-infected controls treated with non-immune sera developed diabetes.
Conclusions/interpretation: Our study demonstrates the utility of frequently collected DBS samples to monitor dynamic proteome changes induced by an environmental trigger during the presymptomatic phase of type 1 diabetes. This approach enables disease interception and can be translated into human initiatives, offering a new method for early detection and intervention in type 1 diabetes.
Data and code availability: Additional data available at https://doi.org/10.17044/scilifelab.27368322 . Additional visualisations are presented in the Shiny app interface https://mouse-dbs-profiling.serve.scilifelab.se/ .
Keywords: Biomarkers; Coxsackievirus B; Disease intervention; Disease prediction; Disease trigger; Dried blood spots; Enterovirus; Immune-mediated diseases; Machine learning; Microsampling; Proteomics; Proximity extension assay; Screening; Type 1 diabetes.
© 2025. The Author(s).
Conflict of interest statement
Acknowledgements: We extend our gratitude to S. Parvin from Karolinska Institutet, Stockholm, Sweden, for her invaluable assistance with histological analyses. We also thank the animal staff at the Preclinical Laboratory (PKL) Facility, Karolinska University Hospital Huddinge and Karolinska Institutet, for their support in breeding and housing the experimental animals. We thank L. Dahl (KTH, Stockholm, Sweden) for all the fruitful discussions and the team at SciLifeLab’s Affinity Proteomics Unit in Stockholm, Sweden for technical support. Data availability: Upon publication, all data needed to evaluate the conclusions in the paper are present in the paper, the supplementary materials, and/or are accessible at https://doi.org/ https://doi.org/10.17044/scilifelab.27368322 . Additional visualisations are presented in the Shiny app interface ( https://mouse-dbs-profiling.serve.scilifelab.se/ ). Material requests should be sent to the corresponding authors M. Flodström-Tullberg and J. M. Schwenk. Code availability: Codes used in this work will be made available upon publication via the Schwenk Lab’s GitHub account under ‘Mouse-DBS-Profiling’. Funding: Open access funding provided by Karolinska Institute. This work was supported by grants from the Swedish Child Diabetes Foundation (MFT); the Swedish Diabetes Foundation (MFT); the Karolinska Institutet, Sweden, including the Strategic Research Programme in Diabetes (MFT); the Swedish Research Council, grant numbers 2020-02969 (MFT) and 2022-01374 (NR); the Novo Nordic Foundation NNF18OC0034158 (MFT) and NNF24OC0092507 (MFT); KTH Royal Institute of Technology, Digital Futures seed funding grant (SB, NR, JMS); SciLifeLab’s Pandemic Laboratory Preparedness program VC-2021-0033 (JMS) and VC-2022-0028 (JMS). Authors’ relationships and activities: MFT has served on the scientific advisory board of Provention Bio Inc. (acquired by Sanofi in 2023). NR is a co-founder and shareholder of the microsampling companies Capitainer AB and Samplimy Medical AB, and an inventor of several patents on microsampling solutions. Unrelated to this work, JMS has received travel support from Olink AB, and via the institution, conducted contract research for Capitainer AB. All other authors declare that there are no relationships or activities that might bias, or be perceived to bias, their work. Contribution statement: MFT, JMS and NR conceived the study. MFT, JMS, NR and SB designed and supervised the research. AP, AB, FB, VMS, EA, EER, MB and SK performed the experimental work. AP, AB, FB, EA, MFT and JMS performed data analysis and visualisation. MFT, AB, FB and JMS wrote the original manuscript draft. All authors reviewed the manuscript and AB, AP, VMS, EER, NR, JMS and MFT edited it. All authors approved the final version for submission. MFT and JMS are the guarantors of this work.
Figures
References
-
- Ashley EA (2015) The precision medicine initiative: a new national effort. JAMA 313(21):2119–2120. 10.1001/jama.2015.3595 - PubMed
-
- Yau C, Danska JS (2024) Cracking the type 1 diabetes code: Genes, microbes, immunity, and the early life environment. Immunol Rev 325(1):23–45. 10.1111/imr.13362 - PubMed
-
- Carre A, Vecchio F, Flodström-Tullberg M, You S, Mallone R (2023) Coxsackievirus and type 1 diabetes: diabetogenic mechanisms and implications for prevention. Endocr Rev 44(4):737–751. 10.1210/endrev/bnad007 - PubMed
MeSH terms
Substances
Grants and funding
LinkOut - more resources
Full Text Sources
Medical
Miscellaneous
