

Open-radiomics: a collection of standardized datasets and a technical protocol for reproducible radiomics machine learning pipelines
- PMID: 40760408
- PMCID: PMC12323200
- DOI: 10.1186/s12880-025-01855-2
Open-radiomics: a collection of standardized datasets and a technical protocol for reproducible radiomics machine learning pipelines
Abstract
Background: As an important branch of machine learning pipelines in medical imaging, radiomics faces two major challenges namely reproducibility and accessibility. In this work, we introduce open-radiomics, a set of radiomics datasets along with a comprehensive radiomics pipeline based on our proposed technical protocol to investigate the effects of radiomics feature extraction on the reproducibility of the results.
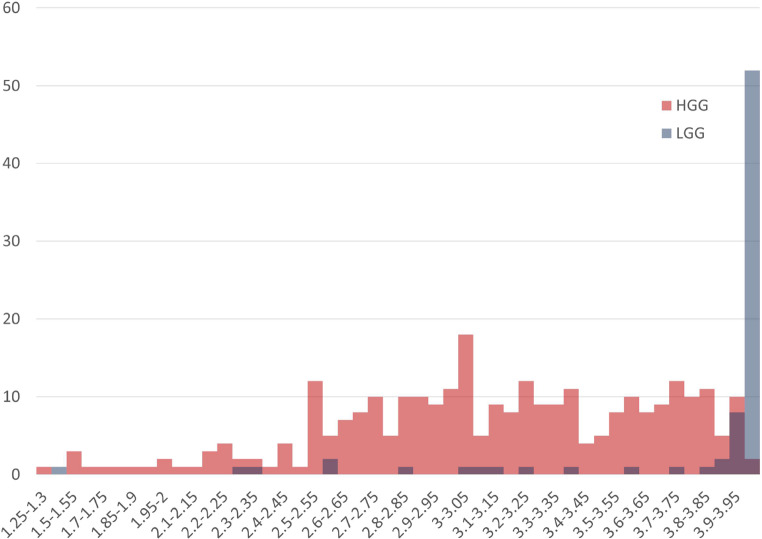
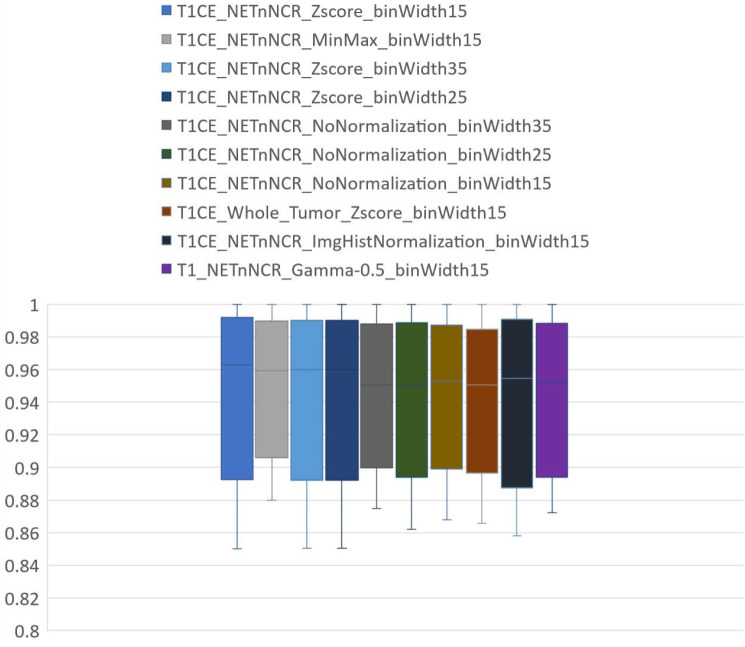
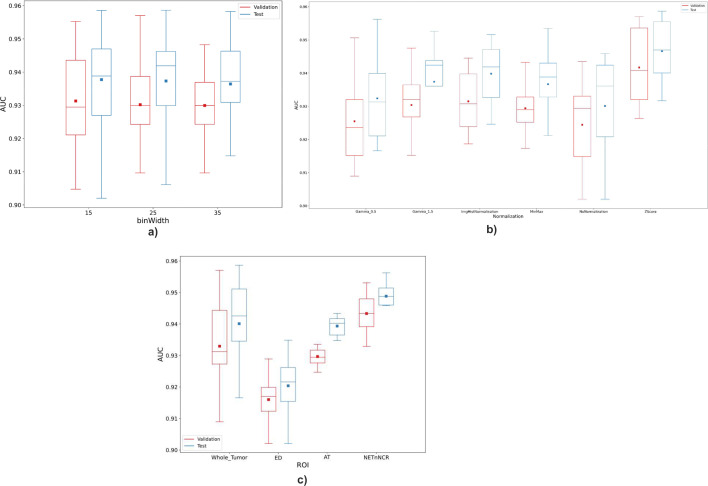
Methods: We curated large-scale radiomics datasets based on three open-source datasets; BraTS 2020 for high-grade glioma (HGG) versus low-grade glioma (LGG) classification and survival analysis, BraTS 2023 for O6-methylguanine-DNA methyltransferase (MGMT) classification, and non-small cell lung cancer (NSCLC) survival analysis from the Cancer Imaging Archive (TCIA). We used the BraTS 2020 open-source Magnetic Resonance Imaging (MRI) dataset to demonstrate how our proposed technical protocol could be utilized in radiomics-based studies. The cohort includes 369 adult patients with brain tumors (76 LGG, and 293 HGG). Using PyRadiomics library for LGG vs. HGG classification, we created 288 radiomics datasets; the combinations of 4 MRI sequences, 3 binWidths, 6 image normalization methods, and 4 tumor subregions. We used Random Forest classifiers, and for each radiomics dataset, we repeated the training-validation-test (60%/20%/20%) experiment with different data splits and model random states 100 times (28,800 test results) and calculated the Area Under the Receiver Operating Characteristic Curve (AUROC).
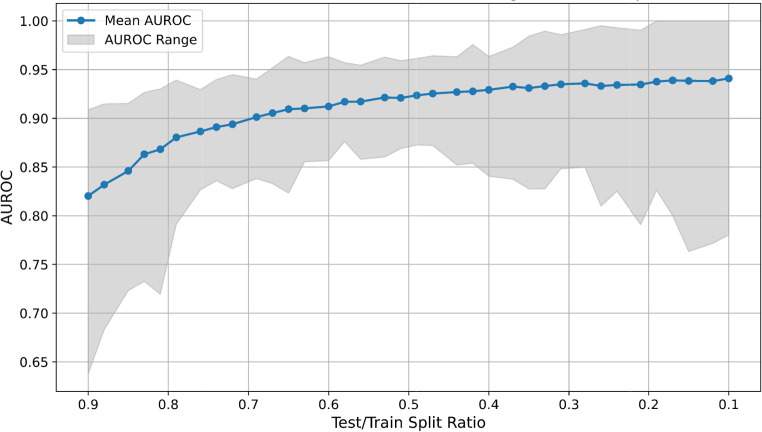
Results: Unlike binWidth and image normalization, the tumor subregion and imaging sequence significantly affected performance of the models. T1 contrast-enhanced sequence and the union of Necrotic and the non-enhancing tumor core subregions resulted in the highest AUROCs (average test AUROC 0.951, 95% confidence interval of (0.949, 0.952)). Although several settings and data splits (28 out of 28800) yielded test AUROC of 1, they were irreproducible.
Conclusions: Our experiments demonstrate the sources of variability in radiomics pipelines (e.g., tumor subregion) can have a significant impact on the results, which may lead to superficial perfect performances that are irreproducible.
Clinical trial number: Not applicable.
Keywords: Brain cancer; Dataset; Open-source; Radiomics; Reproducibility.
© 2025. The Author(s).
Conflict of interest statement
Declarations. Ethics approval and consent to participate: Not applicable. Consent for publication: Not applicable. Competing interests: The authors declare no competing interests.
Figures


References
-
- Liu X, et al. Application of radiomic MRI quantitative features in diagnosis of combined hepatocellular-cholangiocarcinoma, cholangiocarcinoma and hepatocellular carcinoma using machine learning. In: RSNA; 2019.
-
- Liu X, et al. Can machine learning radiomics provide pre-operative differentiation of combined hepatocellular cholangiocarcinoma from hepatocellular carcinoma and cholangiocarcinoma to inform optimal treatment planning? Eur Radiol. 2020. 10.1007/s00330-020-07119-7. - PubMed
-
- Breiman L. Random forests. Mach Learn. 2001;45(1):5–32.
MeSH terms
Grants and funding
LinkOut - more resources
Full Text Sources
Medical
Research Materials
