

Assessing ambient air pollution's effects on birth outcomes: a Scottish IVF cohort study (2010 -2018)
- PMID: 40760439
- PMCID: PMC12323187
- DOI: 10.1186/s12940-025-01204-4
Assessing ambient air pollution's effects on birth outcomes: a Scottish IVF cohort study (2010 -2018)
Abstract
Background: Ambient air pollution exposure during and before the pregnancy could result in adverse birth outcomes. This study uses data from women undergoing in vitro fertilization (IVF) data to investigate the associations between ambient air pollution exposure and adverse birth outcomes.
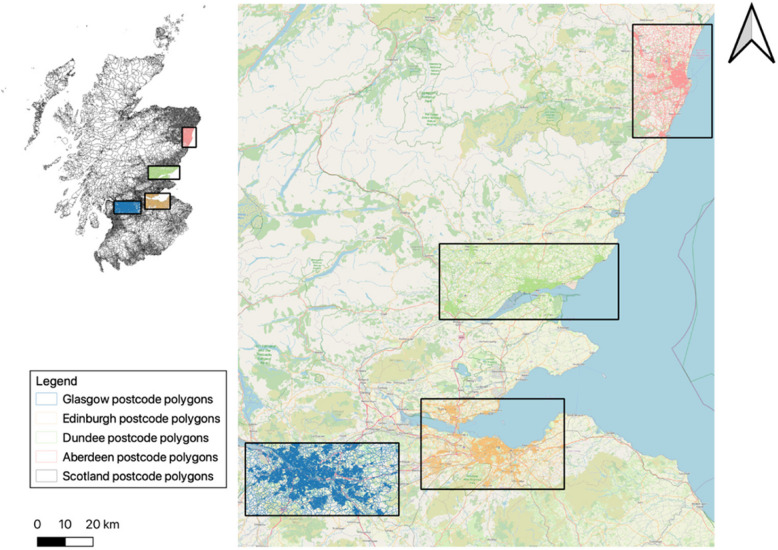
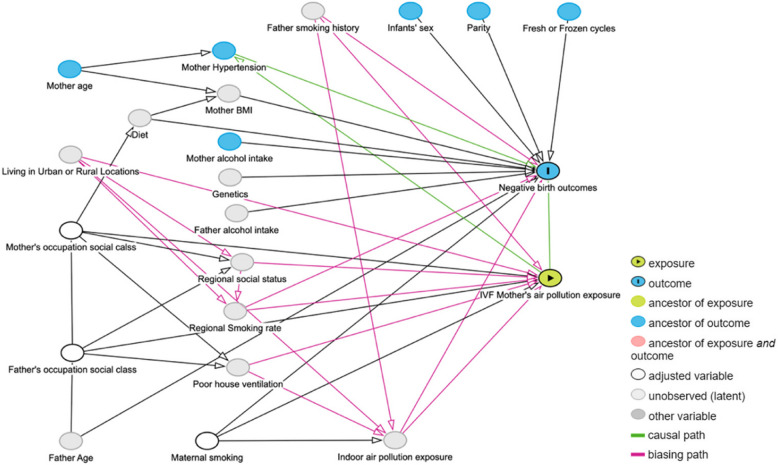
Methods: This study analyses the associations between adverse birth outcomes, namely low birth weight (LBW), small for gestational age (SGA), and preterm birth and daily mean air pollution exposure during each of four IVF windows. The air pollutants considered were particulate matter with an aerodynamic diameter of less than 10 µm (PM10) and 2.5 µm (PM2.5), as well as nitrogen dioxide (NO2), which were estimated using the Atmospheric Dispersion Modelling System (ADMS-Urban). This data was linked to the IVF patients' postcode providing estimates of exposure to air pollutants. Logistic regression models were used to quantify the associations between air pollution exposure and adverse birth outcomes, and conditioning confounding factors. A subgroup analysis was conducted to investigate the differences in the effects of ambient air pollution exposure on the ICSI and IVF groups.
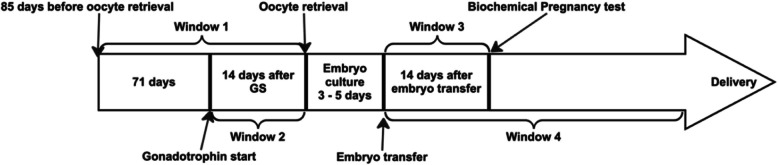
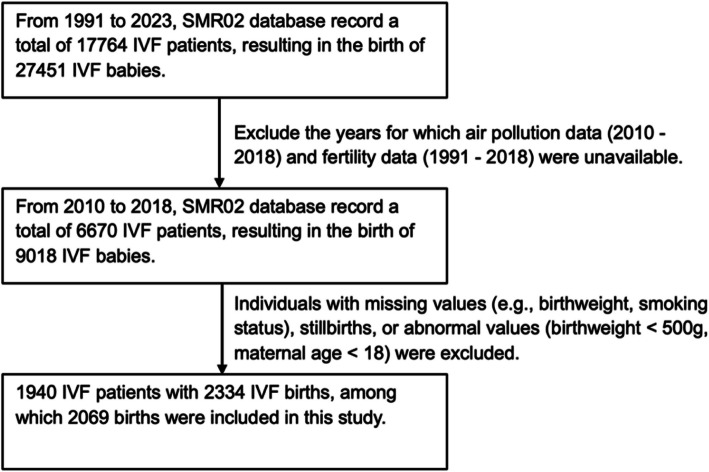
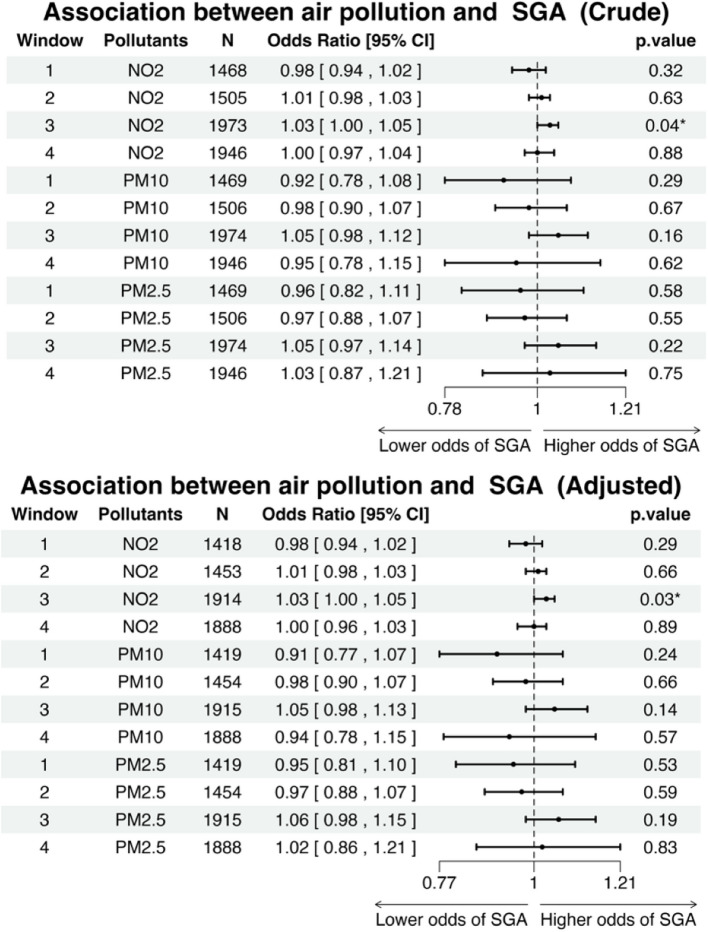
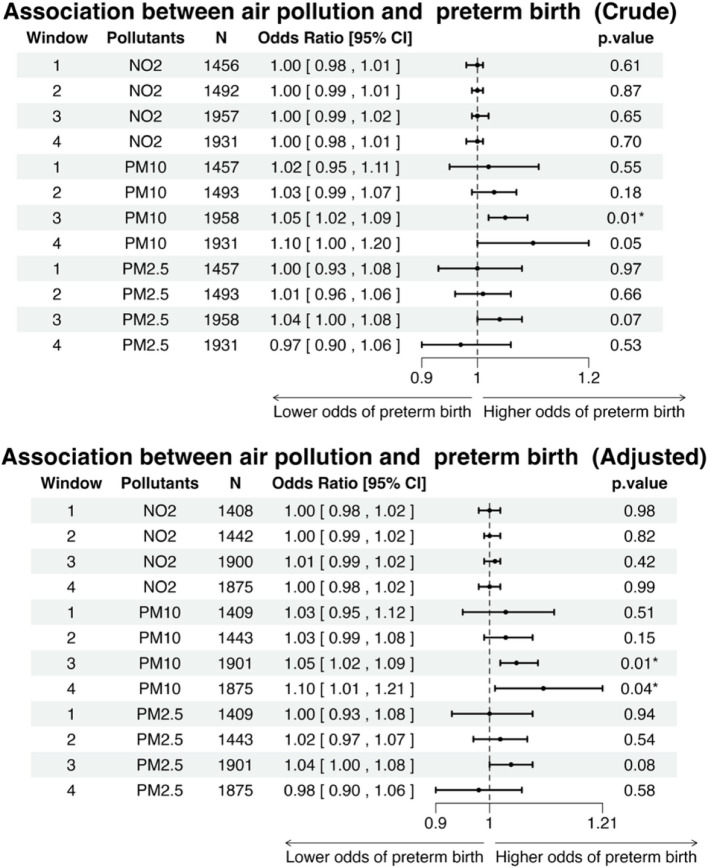
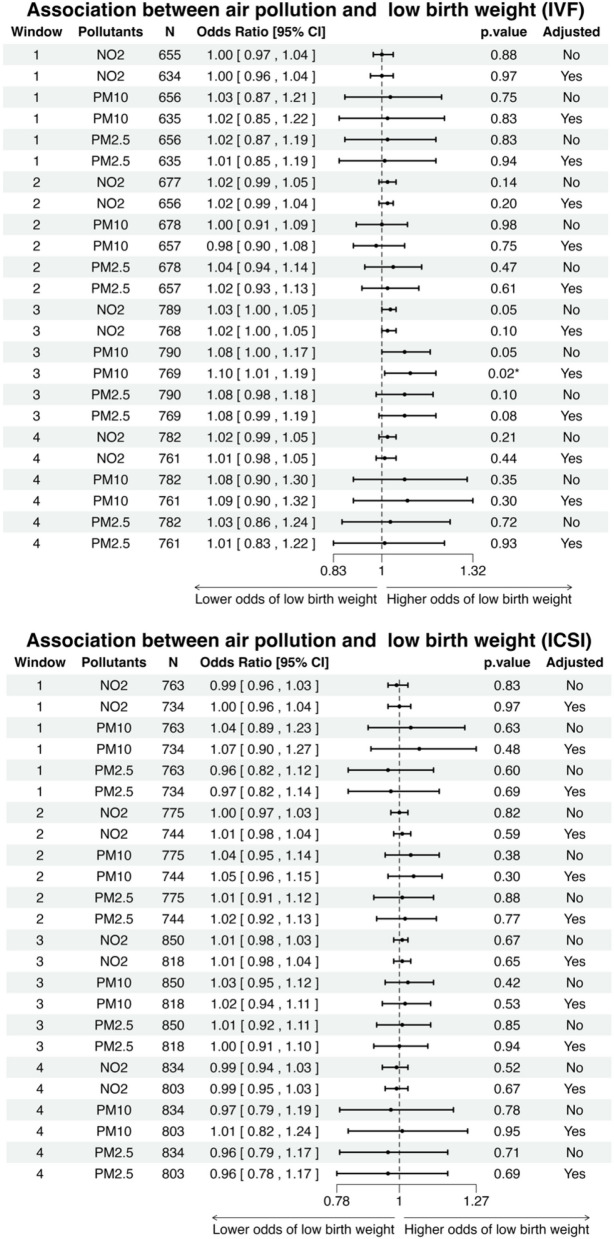
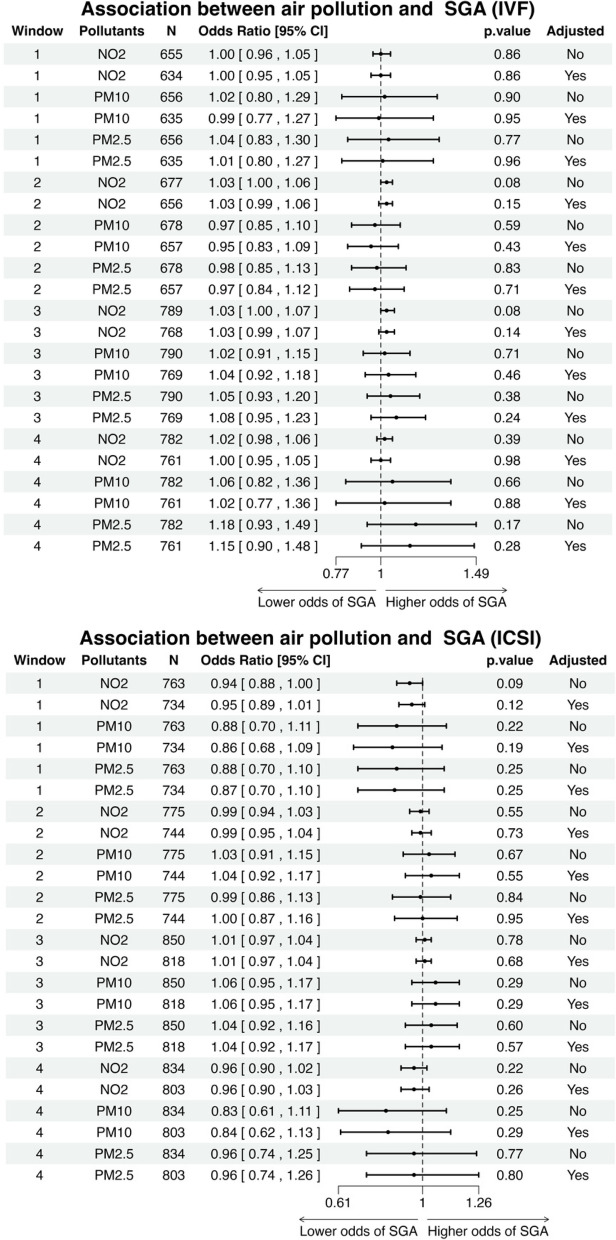
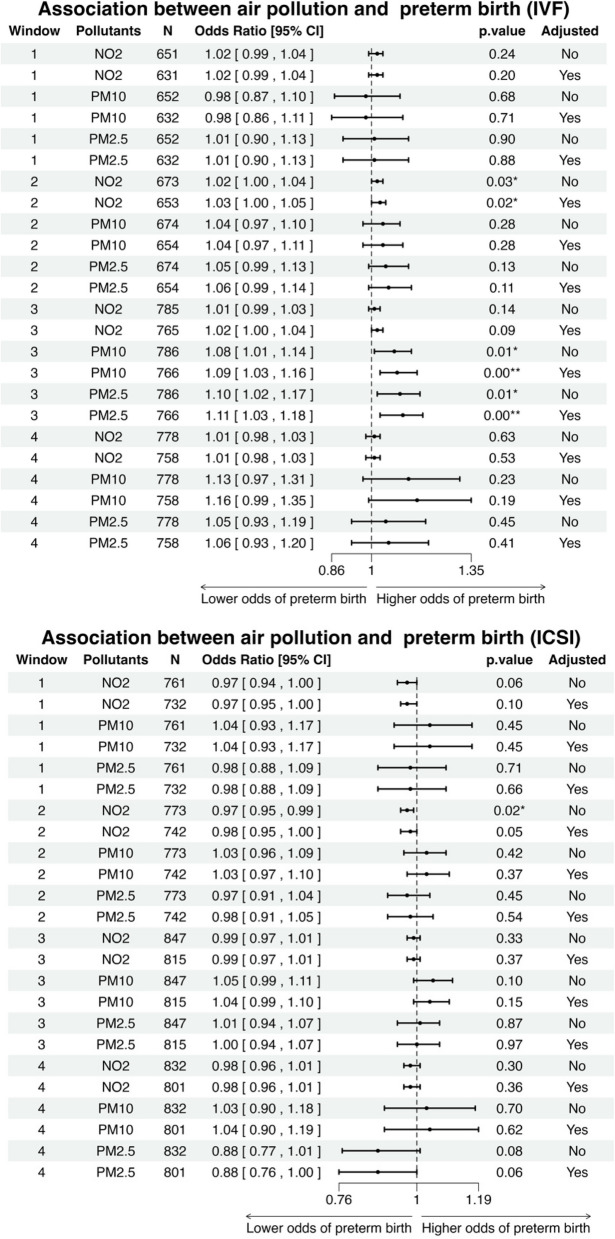
Results: From January 2010 to May 2018, there are 2069 babies were able to be included in this study. We found no significant associations between air pollution exposure and the risk of adverse birth outcomes during window 1(85 days before oocyte retrieval) and 2 (14 days after gonadotrophin medication). With 1 µg⋅m-3 increase in PM10 concentration during window 3 (14 days after embryo transfer) and 4 (embryo transfer to delivery) led to a 5% (95% CI: 1.05-1.06) and 10% (95% CI: 1.01-1.21) increase in the odds of preterm birth, but not other outcomes. In window 3, every 1 µg⋅m-3 increase in NO2 concentrations resulted in a 2% (95% CI: 1.00 - 1.04) increase in the odds of LBW and a 3% (95% CI: 1.00 -1.05) increase in the odds of SGA but showed no effect for preterm birth. The results of the subgroup analysis suggest that the air pollution exposure may have a greater impact on the IVF group compared to the ICSI group.
Conclusion: The results suggest that exposure to air pollution during the very early stage of pregnancy (14 days after conception) may represent the most critical window of susceptibility to an increased risk of adverse birth outcomes.
Keywords: ADMS-Urban; Air pollution; ICSI; IVF; Low birth weight; Preterm birth; SGA.
© 2025. The Author(s).
Conflict of interest statement
Declarations. Competing interests: The authors declare no competing interests.
Figures


Similar articles
-
Association Between Ambient Air Pollution and Birth Weight by Maternal Individual- and Neighborhood-Level Stressors.JAMA Netw Open. 2022 Oct 3;5(10):e2238174. doi: 10.1001/jamanetworkopen.2022.38174. JAMA Netw Open. 2022. PMID: 36282504 Free PMC article.
-
Association Between Individual Air Pollution (PM10, PM2.5) Exposure and Adverse Pregnancy Outcomes in Korea: A Multicenter Prospective Cohort, Air Pollution on Pregnancy Outcome (APPO) Study.J Korean Med Sci. 2024 Apr 8;39(13):e131. doi: 10.3346/jkms.2024.39.e131. J Korean Med Sci. 2024. PMID: 38599601 Free PMC article.
-
Associations between life course exposure to ambient air pollution with cognition and later-life brain structure: a population-based study of the 1946 British Birth Cohort.Lancet Healthy Longev. 2025 Jul;6(7):100724. doi: 10.1016/j.lanhl.2025.100724. Epub 2025 Jul 17. Lancet Healthy Longev. 2025. PMID: 40684776
-
In vitro maturation in subfertile women with polycystic ovarian syndrome undergoing assisted reproduction.Cochrane Database Syst Rev. 2025 Feb 6;2(2):CD006606. doi: 10.1002/14651858.CD006606.pub5. Cochrane Database Syst Rev. 2025. PMID: 39912435
-
Day three versus day two embryo transfer following in vitro fertilization or intracytoplasmic sperm injection.Cochrane Database Syst Rev. 2016 Dec 14;12(12):CD004378. doi: 10.1002/14651858.CD004378.pub3. Cochrane Database Syst Rev. 2016. PMID: 27976360 Free PMC article.
References
-
- Agarwal A, Maldonado Rosas I, Anagnostopoulou C, Cannarella R, Boitrelle F, Munoz LV, Finelli R, Durairajanayagam D, Henkel R, Saleh R. Oxidative stress and assisted reproduction: a comprehensive review of its pathophysiological role and strategies for optimizing embryo culture environment. Antioxidants. 2022;11(3):477. - PMC - PubMed
-
- Aitken RJ. Impact of oxidative stress on male and female germ cells: implications for fertility. Reproduction. 2020;159(4):R189–201. - PubMed
-
- Barker DJP, Godfrey KM, Osmond C, Bull A. The relation of fetal length, ponderal index and head circumference to blood pressure and the risk of hypertension in adult life. Paediatr Perinat Epidemiol. 1992;6(1):35–44. - PubMed
MeSH terms
Substances
LinkOut - more resources
Full Text Sources
Medical
