

Identification and validation of ANXA3 and SOCS3 as biomarkers for acute myocardial infarction related to sphingolipid metabolism
- PMID: 40760666
- PMCID: PMC12323171
- DOI: 10.1186/s41065-025-00515-3
Identification and validation of ANXA3 and SOCS3 as biomarkers for acute myocardial infarction related to sphingolipid metabolism
Abstract
Background: Sphingolipid metabolism (SM) is linked to acute myocardial infarction (AMI), but its role remains unclear. This study explored SM-related genes (SMRGs) in AMI to support clinical diagnosis.
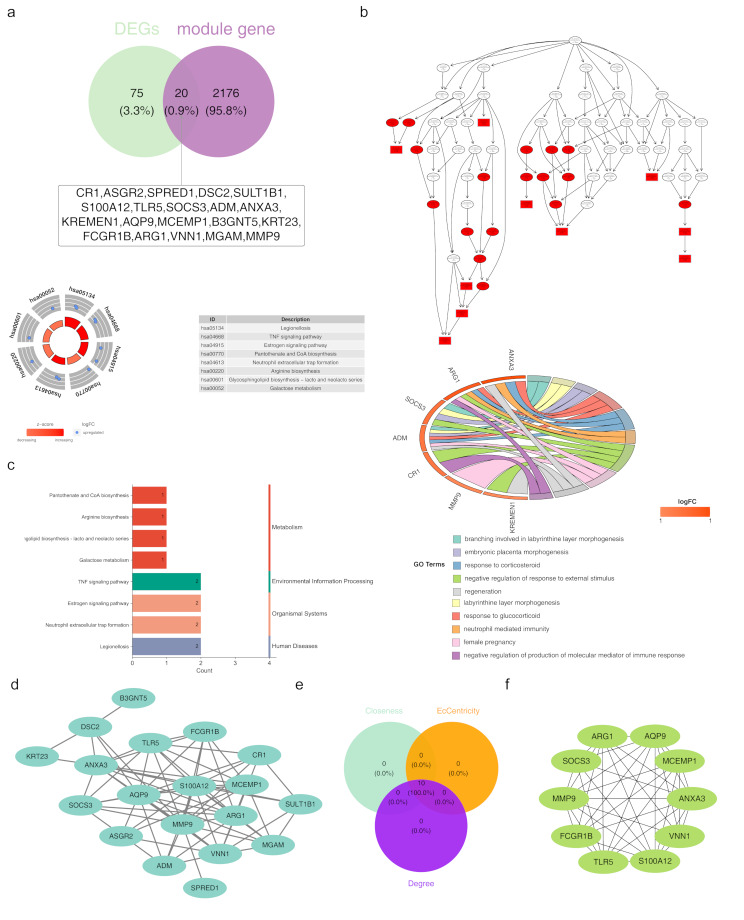
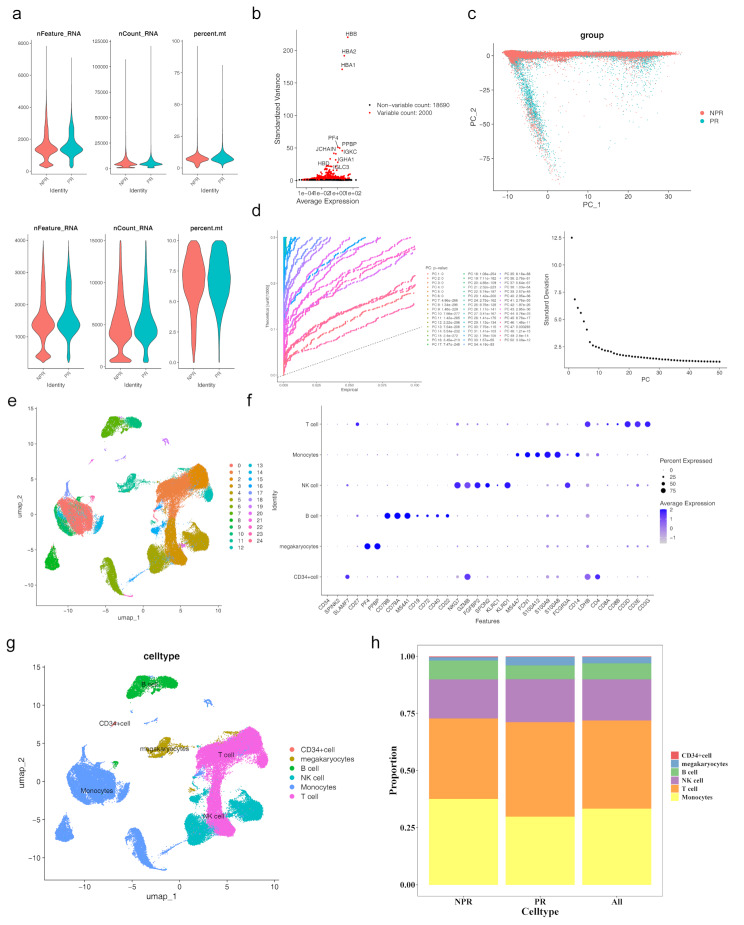
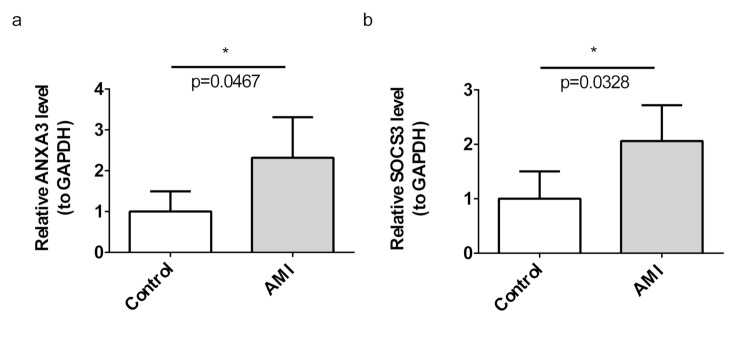
Methods: We analyzed datasets GSE48060 and GSE123342 to identify differentially expressed genes (DEGs) and key module genes. Protein-protein interaction (PPI) network analysis and machine learning were used to screen potential biomarkers, which were validated via receiver operating characteristic (ROC) curves and expression assessment. Further analyses included artificial neural networks (ANN), enrichment analysis, immune infiltration, drug prediction, and molecular docking. Single-cell RNA sequencing (scRNA-seq) identified key cell types and their functions. Biomarkers were validated via reverse transcription quantitative polymerase chain reaction (RT-qPCR).
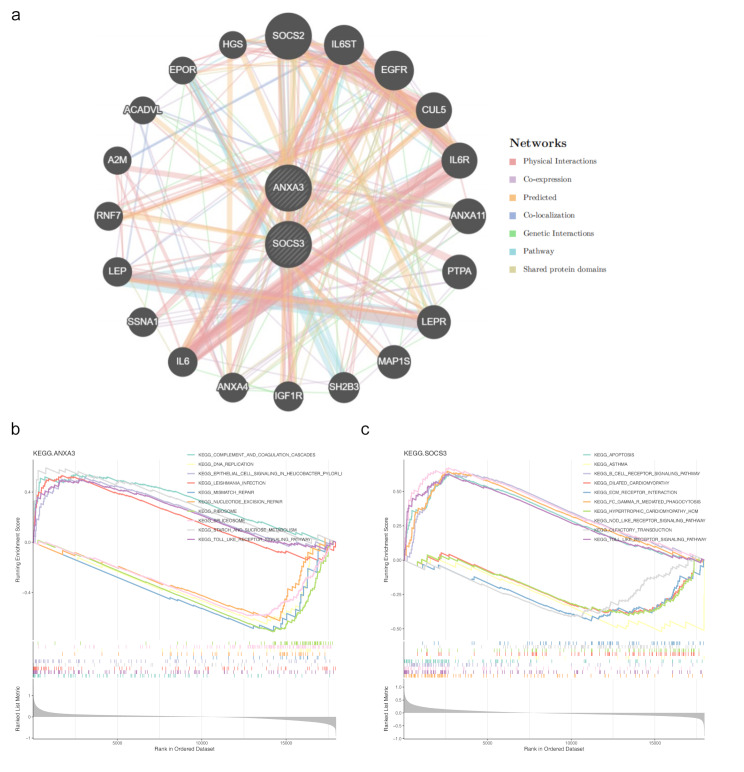
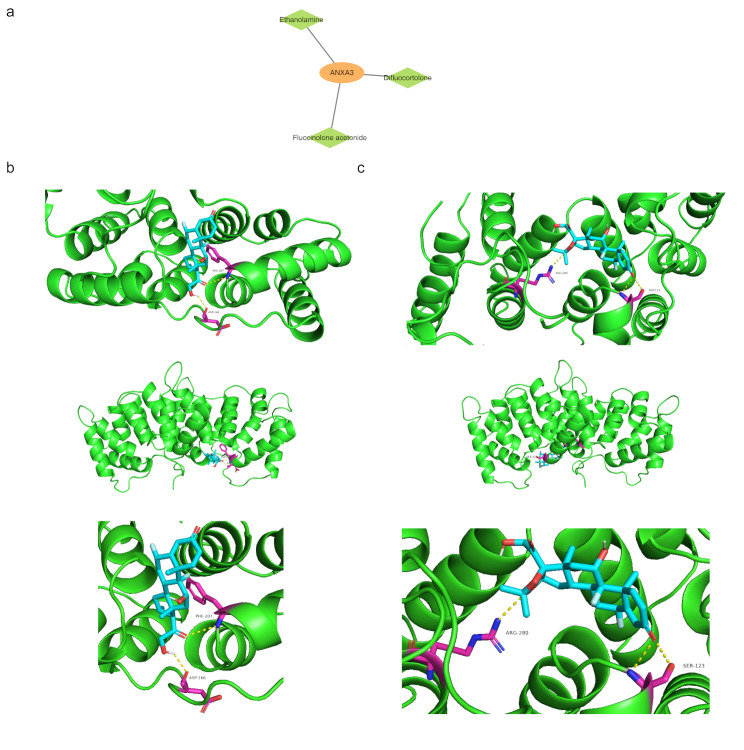
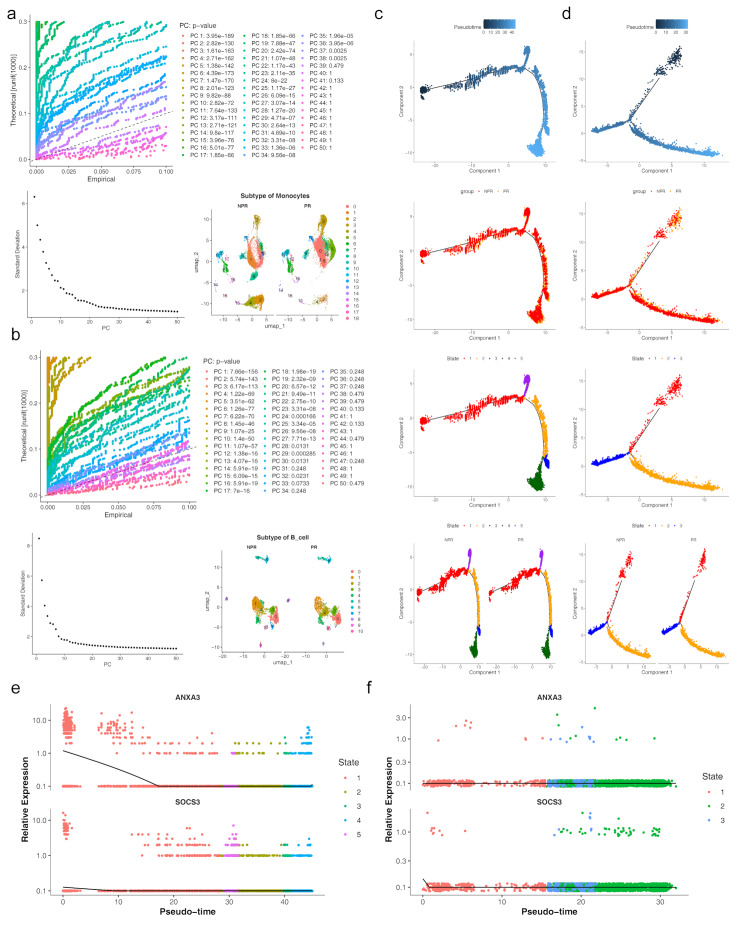
Results: Intersection of 95 DEGs and 2,196 module genes yielded 20 genes, with ANXA3 and SOCS3 identified as biomarkers. The ANN model showed superior diagnostic performance compared to individual markers. Biomarkers were enriched in the toll-like receptor (TLR) signaling pathway. Immune infiltration analysis revealed differences in five immune cell types between AMI and control groups. ANXA3 correlated positively with neutrophils and negatively with resting memory CD4 T cells. Drugs targeting ANXA3 included ethanolamine, difluocortolone, and fluocinolone acetonide, with strong binding affinity. scRNA-seq identified B cells and monocytes as key cells; ANXA3 and SOCS3 expression increased during monocyte differentiation before decreasing, while B cells showed no significant changes.
Conclusion: ANXA3 and SOCS3 were identified as SM-related biomarkers in AMI, providing insights for clinical diagnosis.
Keywords: Acute myocardial infarction; Immune microenvironment; Machine learning; Single cell RNA analysis; Sphingolipid metabolism.
© 2025. The Author(s).
Conflict of interest statement
Declarations. Ethics approval and consent to participate: This study was performed in line with the principles of the Declaration of Helsinki. Approval was granted by the Ethics Committee of the First Hospital of Jiaxing Affiliated Hospital of Jiaxing University (2022-LY-002). Consent for publication: Not applicable. Competing interests: The authors declare no competing interests.
Figures


Similar articles
-
Comprehensive analysis of diagnostic biomarkers related to histone acetylation in acute myocardial infarction.BMC Med Genomics. 2025 Apr 18;18(1):75. doi: 10.1186/s12920-025-02135-2. BMC Med Genomics. 2025. PMID: 40251588 Free PMC article.
-
Identification of clinical diagnostic and immune cell infiltration characteristics of acute myocardial infarction with machine learning approach.Sci Rep. 2025 Jul 20;15(1):26315. doi: 10.1038/s41598-025-11957-0. Sci Rep. 2025. PMID: 40685440 Free PMC article.
-
Construction of a Disulfidptosis-Related Prediction Model for Acute Myocardial Infarction Based on Transcriptome Data.Zhongguo Yi Xue Ke Xue Yuan Xue Bao. 2025 Jun 30;47(3):354-365. doi: 10.3881/j.issn.1000-503X.16057. Zhongguo Yi Xue Ke Xue Yuan Xue Bao. 2025. PMID: 40704466
-
Plasma proteomics implicate glutamic oxaloacetic transaminases as potential markers for acute myocardial infarction.J Proteomics. 2024 Sep 30;308:105286. doi: 10.1016/j.jprot.2024.105286. Epub 2024 Aug 20. J Proteomics. 2024. PMID: 39173902 Review.
-
Comparing the Performance of Machine Learning Models and Conventional Risk Scores for Predicting Major Adverse Cardiovascular Cerebrovascular Events After Percutaneous Coronary Intervention in Patients With Acute Myocardial Infarction: Systematic Review and Meta-Analysis.J Med Internet Res. 2025 Jul 18;27:e76215. doi: 10.2196/76215. J Med Internet Res. 2025. PMID: 40680235 Free PMC article.
References
-
- Reed GW, Rossi JE, Cannon CP. Acute myocardial infarction. Lancet. 2017;389:197–210. - PubMed
-
- Bacci M, Lorito N, Smiriglia A, Morandi A. Fat and furious: lipid metabolism in antitumoral therapy response and resistance. Trends Cancer. 2021;7:198–213. - PubMed
-
- Alessenko AV. The role of sphingomyelin cycle metabolites in transduction of signals of cell proliferation, differentiation and death. Membr Cell Biol. 2000;13:303–20. - PubMed
-
- Olivera A, Buckley NE, Spiegel S. Sphingomyelinase and cell-permeable ceramide analogs stimulate cellular proliferation in quiescent Swiss 3T3 fibroblasts. J Biol Chem. 1992;267:26121–7. - PubMed
MeSH terms
Substances
Grants and funding
- 2024-ZJZK-001/Clinical Key Specialty Construction Project of Zhejiang Province - - Cardiovascular Medicine
- 2024-ZJZK-001/Clinical Key Specialty Construction Project of Zhejiang Province - - Cardiovascular Medicine
- 2024-ZJZK-001/Clinical Key Specialty Construction Project of Zhejiang Province - - Cardiovascular Medicine
- 2023ZL700/Zhejiang Province Traditional Chinese Medicine Scientific Research Fund
- 2023ZL700/Zhejiang Province Traditional Chinese Medicine Scientific Research Fund
LinkOut - more resources
Full Text Sources
Medical
Research Materials
Miscellaneous
