. 2025 Dec;17(1):2543124.
doi: 10.1080/19490976.2025.2543124. Epub 2025 Aug 4.

Personalized colorectal cancer risk assessment through explainable AI and Gut microbiome profiling

Affiliations

Personalized colorectal cancer risk assessment through explainable AI and Gut microbiome profiling

Pierfrancesco Novielli et al. Gut Microbes. 2025 Dec.

Abstract

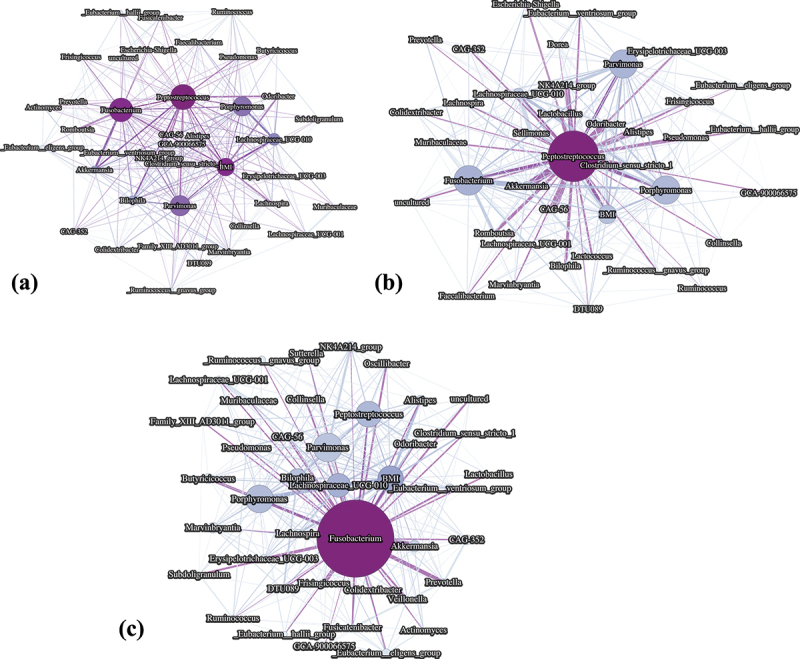
The clinical adenoma - carcinoma progression represents a well-established framework for understanding colorectal cancer (CRC) development, although the molecular mechanisms underlying this transition remain only partially understood. Increasing evidence suggests the gut microbiome (GM) as a key modulator of colorectal carcinogenesis, positioning microbial profiling as a promising avenue for noninvasive risk stratification and early detection. In this study, Machine Learning (ML) classifiers integrated with eXplainable Artificial Intelligence (XAI) techniques were employed to identify microbiome-derived biomarkers predictive of CRC and adenomatous lesions. The models were trained on 16S rRNA sequencing data from 453 patients and evaluated through cross-validation, achieving AU-ROC and AU-PRC scores of 0.71 and 0.67, respectively. External validation on an independent Italian cohort (n=43) yielded AU-ROC and AU-PRC scores of 0.70 and 0.89, respectively. XAI-based interpretation revealed consistent microbial signatures across datasets. In detail, taxa belonging to the Fusobacterium and Peptostreptococcus genera were associated with increased CRC risk, whereas the Eubacterium eligens group was identified as a robust negative predictor. Beyond classification, patient-level explanations enabled by XAI facilitated the identification of adenoma subgroups exhibiting microbiome profiles converging toward those of CRC, suggesting the presence of transitional microbial states. Moreover, SHAP-based interaction networks uncovered microbial hubs and inter-species dependencies characterizing high-risk configurations, providing insights into the ecological dynamics of colorectal tumorigenesis. These findings demonstrate the added XAI value in elucidating microbiome interactions, enhancing model interpretability, and supporting biologically informed hypotheses. This integrative, explainable framework highlights the potential of AI-driven microbiome analysis in precision oncology and advances the development of interpretable, noninvasive tools for CRC risk prediction and management.

Keywords: Explainable AI; SHAP interaction analysis; biomarker; colorectal cancer; microbiome; risk stratification.


Conflict of interest statement

No potential conflict of interest was reported by the author(s).

Figures

Figure 1.
Figure 1.
Experimental workflow of the study. Publicly available 16S rRNA gene sequencing data was used to analyze the adenoma-carcinoma sequence in GM profiles. The workflow starts with preprocessing the GM abundance data and integrating it with clinical metadata (age, BMI, gender, country). Three tree-based machine learning models (XGBoost, Random Forest, and CatBoost) were trained to classify CRC and adenoma cases, followed by SHAP-based interpretation for feature importance and risk subgroup identification in adenoma subjects. The models were further validated on an independent dataset to assess generalization performance.
Figure 2.
Figure 2.
Receiver operating characteristic (ROC) and precision-recall (PR) curves for the CatBoost model. (a) ROC curve illustrating the trade-off between true positive rate and false positive rate. (b) PR curve showing the relationship between precision and recall.
Figure 3.
Figure 3.
SHAP summary plots illustrating feature relevance for the classification of CRC and adenoma. (a) SHAP summary plot for the training dataset, showing the 20 most important features contributing to model predictions, which together account for 47.99% of the total cumulative SHAP importance. (b) SHAP summary plot for the independent test dataset, where the top 20 features account for 52.14% of the total cumulative SHAP importance. Each point represents a patient, with the horizontal axis indicating the SHAP value (impact on model output), and the color representing the feature value (red for high, blue for low).
Figure 4.
Figure 4.
Dimensionality reduction with t-SNE on microbiome data. Subfigure (a) depicts the first two t-SNE components on microbiome data, while subfigure (b) represents the first two t-SNE components on SHAP values with color coding based on the probability of CRC.
Figure 5.
Figure 5.
Clustering analysis of subjects with adenoma on SHAP values. (a) Silhouette score comparison of K-means, Agglomerative clustering, and Birch clustering. (b) t-SNE visualization of adenoma patients in the SHAP embedding, with cluster assignments for the training dataset and external adenoma patients projected into the SHAP space using a KNN model. (c) Box plot showing the distribution of predicted CRC probabilities across the different clusters, with red X’s marking the probabilities of adenoma patients from the external test set.
Figure 6.
Figure 6.
Boxplots showing the distribution of the relative abundance of Peptostreptococcus, Fusobacterium and Eubacterium_eligens_group bacteria across clusters. Red X’s represent the values for adenoma patients from the independent test set.
Figure 7.
Figure 7.
Weighted SHAP interaction networks. (a) Interaction network derived from all subjects in the training dataset, showing feature nodes sized by their number of interactions, colored by degree, and edges scaled by interaction intensity. (b) Network for subjects in Cluster 2 (high-risk group). (c) Network for subjects in Cluster 5 (second highest-risk group).

References

    1. Keum N, Giovannucci E.. Global burden of colorectal cancer: emerging trends, risk factors and prevention strategies. Nat Rev Gastroenterol Hepatol. 2019;16(12):713–18. doi: 10.1038/s41575-019-0189-8. - DOI - PubMed
    1. Allen J, Sears CL.. Impact of the gut microbiome on the genome and epigenome of colon epithelial cells: contributions to colorectal cancer development. Genome Med. 2019;11(1):1–18. doi: 10.1186/s13073-019-0621-2. - DOI - PMC - PubMed
    1. DeDecker L, Coppedge B, Avelar-Barragan J, Karnes W, Whiteson K. Microbiome distinctions between the crc carcinogenic pathways. Gut Microbes. 2021;13(1):1–12. doi: 10.1080/19490976.2020.1854641. - DOI - PMC - PubMed
    1. Lee S-J, Yun CC. Colorectal cancer cells–proliferation, survival and invasion by lysophosphatidic acid. Int J Biochem Cell Biol. 2010;42(12):1907–1910. doi: 10.1016/j.biocel.2010.09.021. - DOI - PMC - PubMed
    1. Zhao Y, Guo M, Zhao F, Liu Q, Wang X. Colonic stem cells from normal tissues adjacent to tumor drive inflammation and fibrosis in colorectal cancer. Cell Commun Signal. 2023;21(1):186. doi: 10.1186/s12964-023-01140-1. - DOI - PMC - PubMed

Substances

LinkOut - more resources