

Decitabine-Driven Foetal Haemoglobin Induction in Townes Mice and Human Erythroblasts
- PMID: 40761187
- PMCID: PMC12320723
- DOI: 10.1002/jha2.70120
Decitabine-Driven Foetal Haemoglobin Induction in Townes Mice and Human Erythroblasts
Abstract
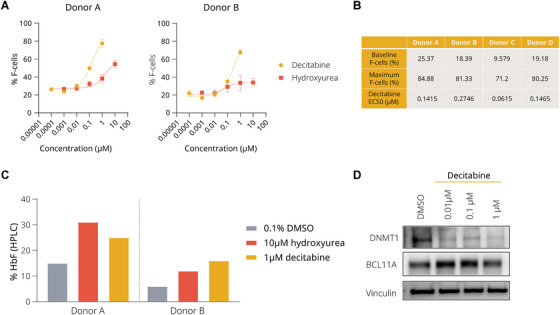
Background: Induction of foetal haemoglobin (HbF) is a clinically validated approach to modulate the severity of sickle cell disease (SCD). This manuscript evaluates the efficacy of decitabine, a DNA methyltransferase (DNMT) inhibitor, in inducing HbF in healthy human erythroblasts and Townes mice, which are well-established systems modelling SCD.
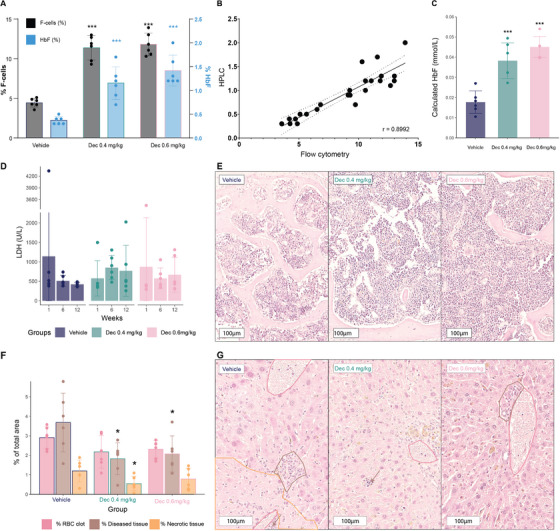
Methods: Healthy human erythroblasts were treated with decitabine, and HbF induction was measured. Townes sickle cell mice were administered decitabine for 12 weeks, and various haematological parameters were assessed.
Results: In healthy human erythroblasts, decitabine treatment resulted in a significant increase in the fraction of HbF-rich cells (F-cells), accompanied by elevated HbF protein levels. The HbF induction was superior to that achieved with hydroxyurea, the primary therapy for SCD. In Townes mice, the maximal response was observed after 12 weeks of dosing, with an increase in both HbF protein and F-cells, alongside reduced red blood cell and reticulocyte counts. Additionally, we observed changes in other haematological parameters, such as increased mean corpuscular volume and mean corpuscular haemoglobin. However, the HbF induction observed in the mice was modest relative to known human responses. No marked improvements in SCD-related biomarkers such as haemolysis or liver function were detected, suggesting that the mouse model may not fully capture the extent of phenotype improvement. Histopathological examination revealed no adverse effects on bone marrow cellularity or morphology and indicated a protective effect on liver tissue integrity.
Conclusion: Our results demonstrate that decitabine induces HbF in a dose-dependent manner in both in vitro and in vivo settings, highlighting the complexity of HbF induction as a treatment for SCD and underscoring the need for further refinement of this model for SCD therapy research. Trial Registration: The authors have confirmed clinical trial registration is not needed for this submission.
Keywords: haemoglobin disorders; haemoglobinopathies; haemolysis; red blood cell disorders; red cell disorders; sickle cell anaemia; sickle cell disease.
© 2025 The Author(s). eJHaem published by British Society for Haematology and John Wiley & Sons Ltd.
Conflict of interest statement
Ariadna Carol Illa, Desmond Wai Loon Chin, Martha Clark, and Carsten Dan Ley are employees and/or shareholders of Novo Nordisk A/S. Søren Skov has received consultancy fees from Novo Nordisk and research support from DSM‐Firmenich and Novo Nordisk. Andreas Glenthøj has received consultancy and advisory board fees from Agios, Novo Nordisk, Pharmacosmos, and Vertex Pharmaceuticals, as well as research support from Agios, Bristol Myers Squibb, Novo Nordisk, Saniona, and Sanofi. Jesper Petersen has nothing to disclose.
Figures


Similar articles
-
Hydroxyurea (hydroxycarbamide) for sickle cell disease.Cochrane Database Syst Rev. 2022 Sep 1;9(9):CD002202. doi: 10.1002/14651858.CD002202.pub3. Cochrane Database Syst Rev. 2022. PMID: 36047926 Free PMC article.
-
Foetal haemoglobin inducers for reducing blood transfusion in non-transfusion-dependent beta-thalassaemias.Cochrane Database Syst Rev. 2023 Jan 13;1(1):CD013767. doi: 10.1002/14651858.CD013767.pub2. Cochrane Database Syst Rev. 2023. PMID: 36637054 Free PMC article.
-
Folate supplementation in people with sickle cell disease.Cochrane Database Syst Rev. 2018 Mar 16;3(3):CD011130. doi: 10.1002/14651858.CD011130.pub3. Cochrane Database Syst Rev. 2018. PMID: 29546732 Free PMC article.
-
Hydroxyurea (hydroxycarbamide) for sickle cell disease.Cochrane Database Syst Rev. 2017 Apr 20;4(4):CD002202. doi: 10.1002/14651858.CD002202.pub2. Cochrane Database Syst Rev. 2017. Update in: Cochrane Database Syst Rev. 2022 Sep 1;9:CD002202. doi: 10.1002/14651858.CD002202.pub3. PMID: 28426137 Free PMC article. Updated.
-
Folate supplementation in people with sickle cell disease.Cochrane Database Syst Rev. 2016 Feb 16;2:CD011130. doi: 10.1002/14651858.CD011130.pub2. Cochrane Database Syst Rev. 2016. Update in: Cochrane Database Syst Rev. 2018 Mar 16;3:CD011130. doi: 10.1002/14651858.CD011130.pub3. PMID: 26880182 Free PMC article. Updated.
References
-
- Charache S., Terrin M. L., Moore R. D., et al., “Effect of Hydroxyurea on the Frequency of Painful Crises in Sickle Cell Anemia. Investigators of the Multicenter Study of Hydroxyurea in Sickle Cell Anemia,” New England Journal of Medicine 332 (1995): 1317–1322, 10.1056/NEJM199505183322001. - DOI - PubMed
LinkOut - more resources
Full Text Sources