

The effects of two combined methods of P53 expression and preoperative serum CEA detection on the prognosis of colorectal cancer
- PMID: 40761246
- PMCID: PMC12318724
- DOI: 10.3389/fonc.2025.1590836
The effects of two combined methods of P53 expression and preoperative serum CEA detection on the prognosis of colorectal cancer
Abstract
Aim: To explore the effects of two combined methods-P53 expression and preoperative serum carcinoembryonic antigen (S-CEA) detection-on the prognosis of colorectal cancer (CRC).
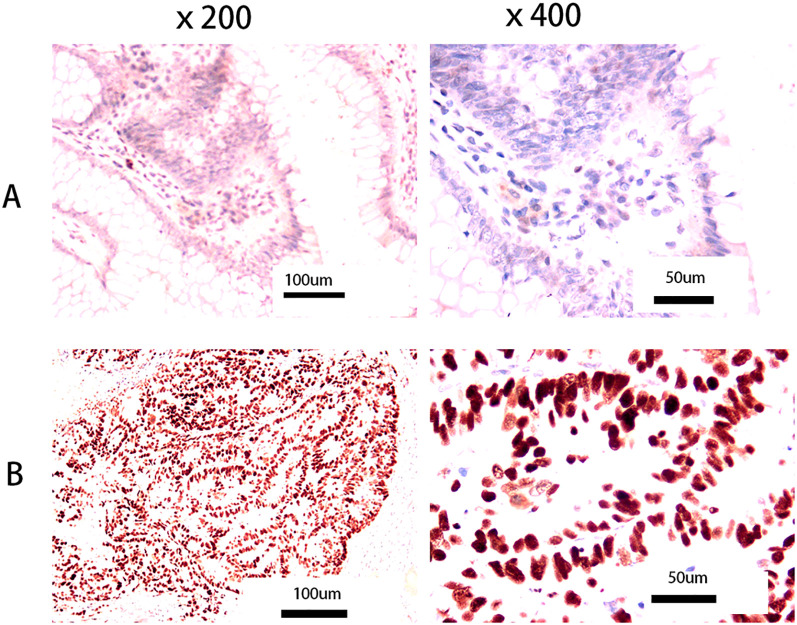
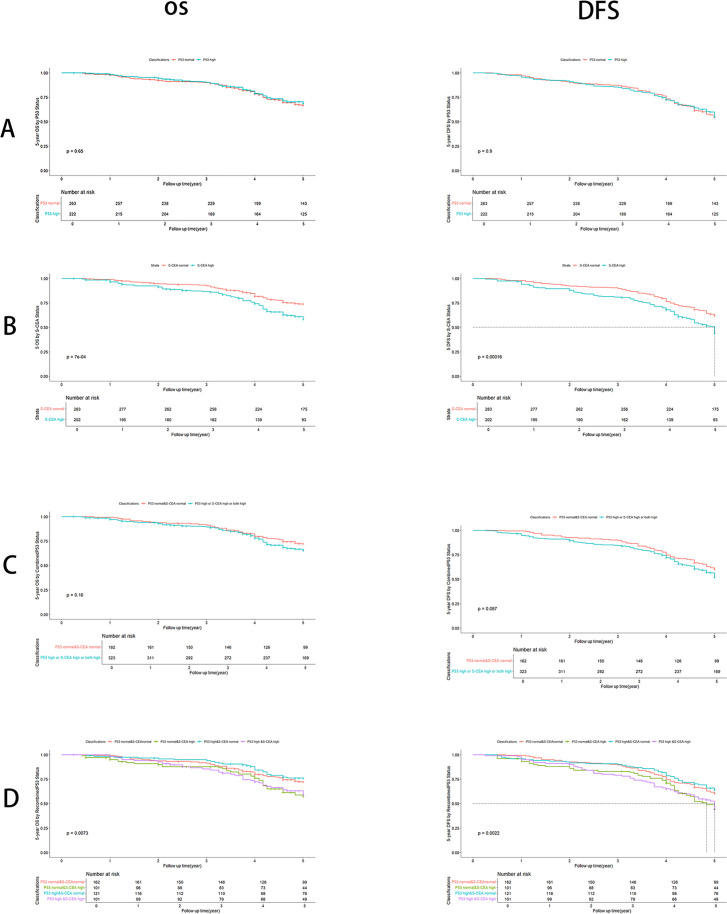
Methods: Two classified combinations of tissue P53 and S-CEA were utilized: Combined P53 groups (normal P53 and S-CEA, or one or both elevated) and Recombined groups (P53 normal & S-CEA normal, P53 normal & S-CEA high, P53 high & S-CEA normal, P53 high & S-CEA high). Clinicopathologic features were analyzed by P53, S-CEA, Combined P53, and Recombined P53. Correlations between them were examined. Overall survival (OS) and disease-free survival (DFS) were evaluated using the Kaplan-Meier method and Log-Rank test. Univariate and multivariate analyses were performed for Combined P53 and Recombined P53 to determine independent factors. Three-year, two-year, and one-year OS and DFS were further analyzed using multimeROC. SPSS 27 and R 4.4.1 were used for analysis.
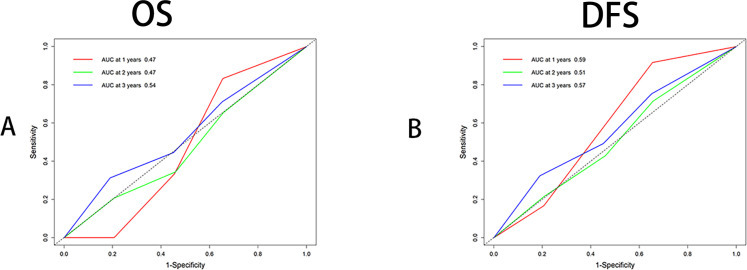
Results: TNM stage, CA199, differentiation, tumor maximum size, and minimum size showed significant differences between the single P53 and S-CEA groups (all P < 0.05). TNM stage, CA199, and chemotherapy differed in both Combined P53 and Recombined P53 groups (all P < 0.05). Significant correlations were found between P53, S-CEA, Combined P53, and Recombined P53 (all P < 0.001). No significant differences in OS and DFS were observed with P53 and Combined P53 (all P > 0.05), but differences were noted with S-CEA and Recombined P53 (all P < 0.05). Univariate and multivariate analyses identified laparoscopy, chemotherapy, differentiation, TNM stage, and Recombined P53 as independent factors for OS and DFS, while P53, S-CEA, and Combined P53 were not. Further multimeROC analysis showed that 3-year OS had better sensitivity and specificity (Area Under Curve [AUC] = 0.54), and 1-year DFS was better (AUC = 0.59).
Conclusions: Recombined P53 classification was more effective than traditional Combined P53 classification for assessing CRC prognosis and was an independent factor. Additionally, the 3-year OS and 1-year DFS analysis demonstrated higher sensitivity and specificity with Recombined P53.
Keywords: CEA; CRC; DFS; OS; ROC; p53; prognosis.
Copyright © 2025 Tong, Wang, Qian, Tan, Shen and Li.
Conflict of interest statement
The authors declare that the research was conducted in the absence of any commercial or financial relationships that could be construed as a potential conflict of interest.
Figures
Similar articles
-
Postoperative adjuvant chemotherapy in rectal cancer operated for cure.Cochrane Database Syst Rev. 2012 Mar 14;2012(3):CD004078. doi: 10.1002/14651858.CD004078.pub2. Cochrane Database Syst Rev. 2012. PMID: 22419291 Free PMC article.
-
The Predictive Value of the Cholesterol-to-Natural Killer Cell Ratio in Colorectal Cancer.J Cancer. 2025 Jun 23;16(9):2946-2958. doi: 10.7150/jca.114813. eCollection 2025. J Cancer. 2025. PMID: 40657373 Free PMC article.
-
Impact of residual disease as a prognostic factor for survival in women with advanced epithelial ovarian cancer after primary surgery.Cochrane Database Syst Rev. 2022 Sep 26;9(9):CD015048. doi: 10.1002/14651858.CD015048.pub2. Cochrane Database Syst Rev. 2022. PMID: 36161421 Free PMC article.
-
Systemic treatments for metastatic cutaneous melanoma.Cochrane Database Syst Rev. 2018 Feb 6;2(2):CD011123. doi: 10.1002/14651858.CD011123.pub2. Cochrane Database Syst Rev. 2018. PMID: 29405038 Free PMC article.
-
Comparison of Two Modern Survival Prediction Tools, SORG-MLA and METSSS, in Patients With Symptomatic Long-bone Metastases Who Underwent Local Treatment With Surgery Followed by Radiotherapy and With Radiotherapy Alone.Clin Orthop Relat Res. 2024 Dec 1;482(12):2193-2208. doi: 10.1097/CORR.0000000000003185. Epub 2024 Jul 23. Clin Orthop Relat Res. 2024. PMID: 39051924
References
LinkOut - more resources
Full Text Sources
Research Materials
Miscellaneous