. 2025 Jul 21:15:1506319.
doi: 10.3389/fonc.2025.1506319. eCollection 2025.

Bladder cancer microbiome and its association with chemoresponse

Affiliations

Bladder cancer microbiome and its association with chemoresponse

Rashida Ginwala et al. Front Oncol. .

Abstract

Background: The microbiome is widely known to cause come types of cancer, modify cancer biology, and impact therapeutic efficacy. Despite the urinary microbiome being one of the most clinically significant microbiomes in human health, it is one of the least well-described.

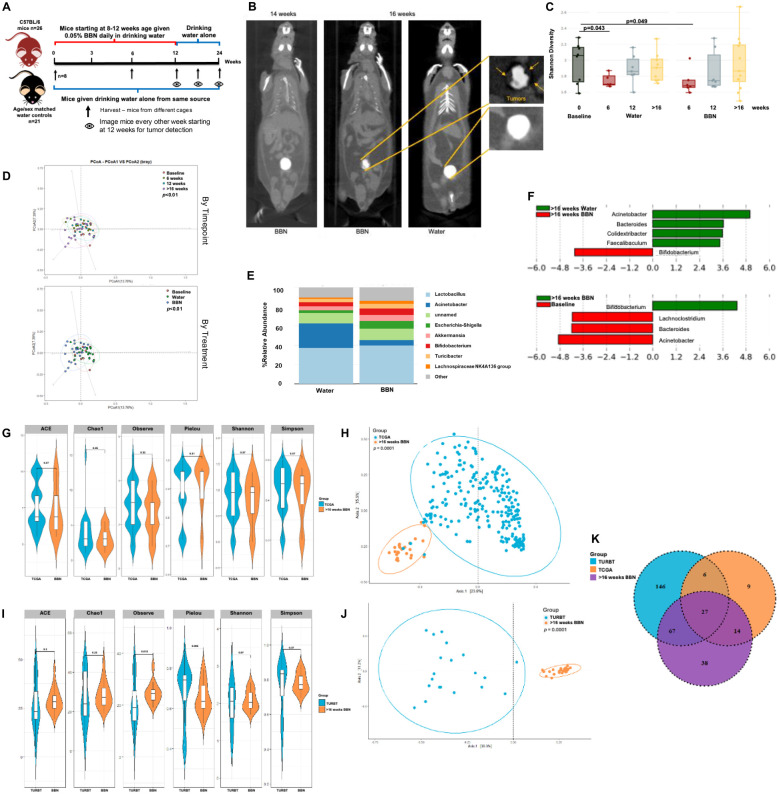
Methods and materials: To begin to annotate the urinary microbiome present in bladder cancers, we analyzed human genome-filtered sequencing data from the Cancer Genome Atlas (TCGA) from 116 tumors (duplicates from 22 tumors), 22 adjacent normal bladder tissues, and 99 blood samples to classify reads originating from known microbiota. We also performed 16S rRNA sequencing on urine samples from 55 patients with urothelial carcinoma and 13 non-cancer patients. Additionally, we compared microbiome from matched urine samples and archival diagnostic tumor samples from 21 bladder cancer patients. For our animal experiments, starting at 8-12 weeks of age, male (n=33) and female (n=22) C57BL/6 mice were administered 0.05% N-butyl-N-(4-hydroxybutyl)-nitrosamine (BBN) in drinking water for 12 weeks then switched to regular water. Control mice drank regular water. Bladders were collected for 16S rRNA sequencing pre-exposure, after 6 and 12 weeks of exposure, and at the time of tumor identification (typically between 14-22 weeks from start of treatment using this model). Finally, because of our findings, we tested the effects of E.coli infection on gemcitabine toxicity in bladder cancer cell lines.

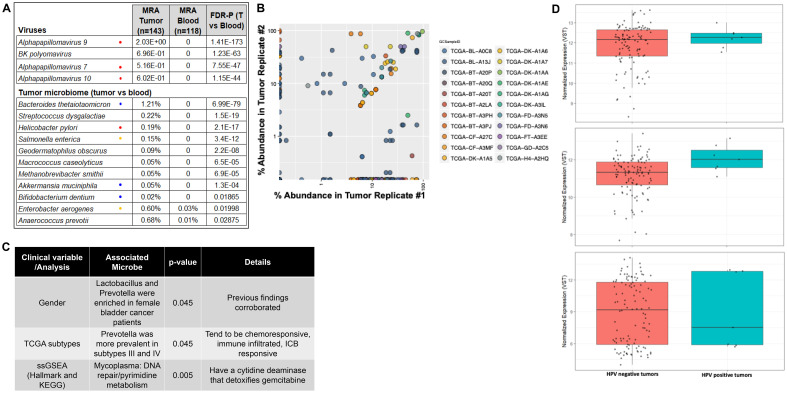
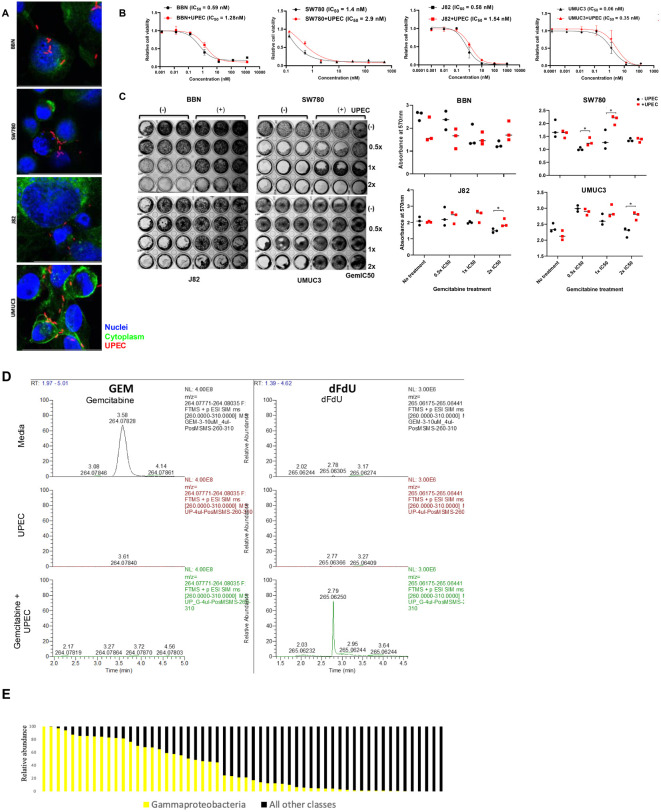
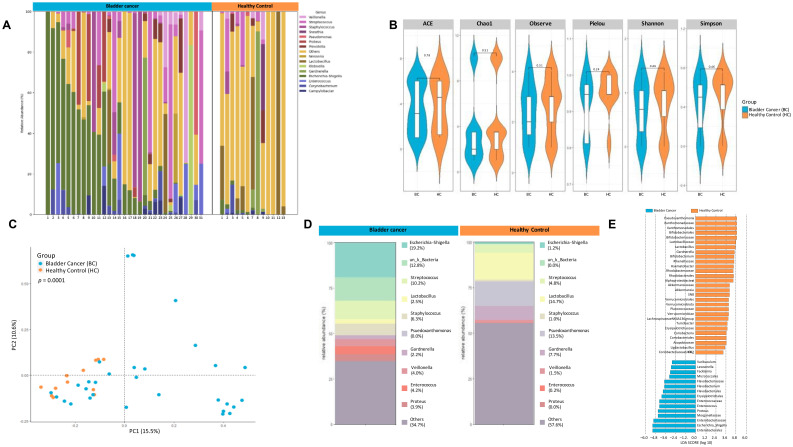
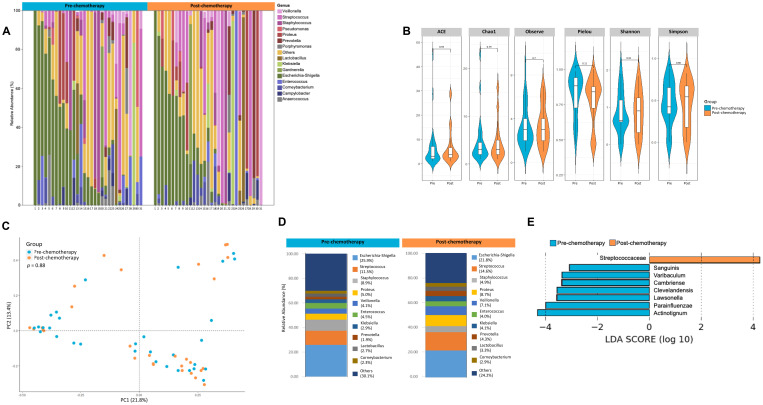
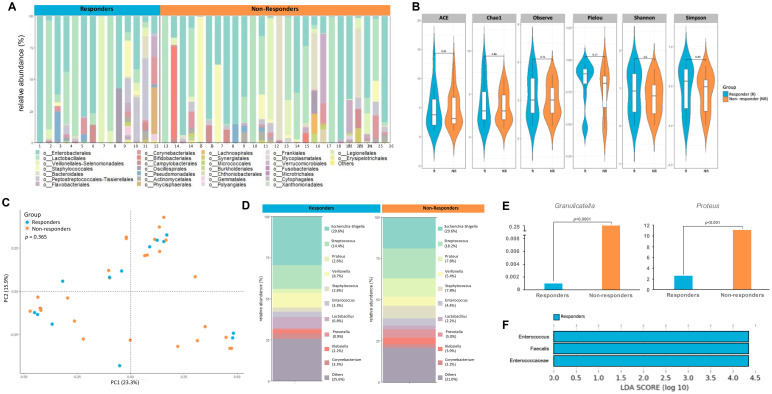
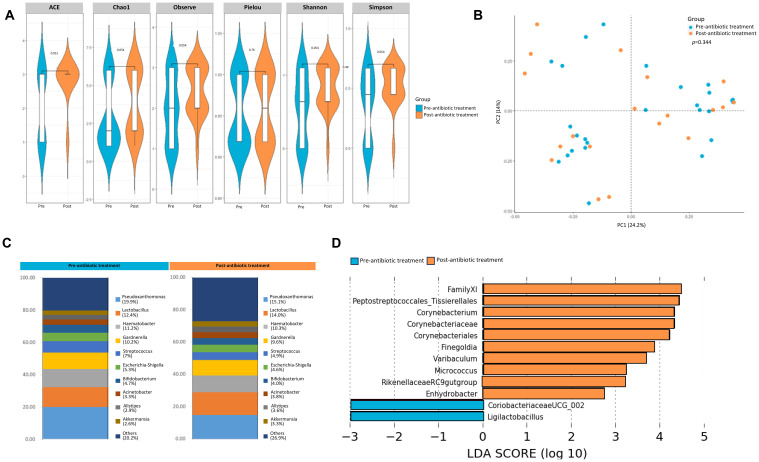
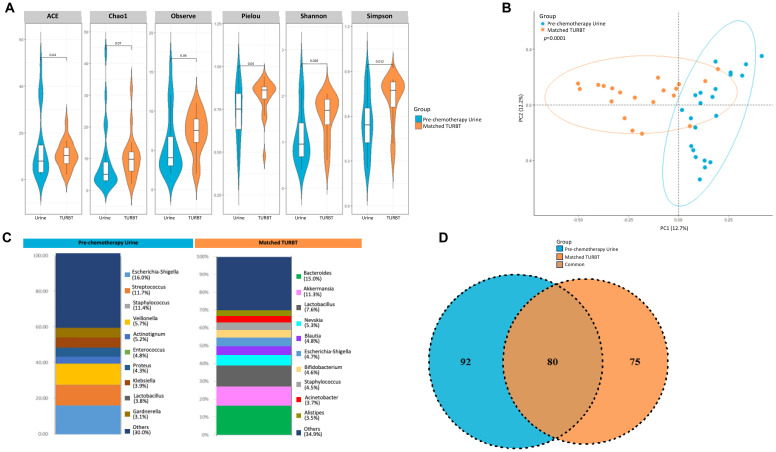
Results: Twenty-seven viral and bacterial species were found to be enriched in the tumor samples from TCGA cohort, including sex-specific enrichment of Lactobacillus and Prevotella in female bladder cancer patients which also are prevalent in the normal female genitourinary tract. We found key differences in urinary microbiota profiles that distinguish cancer patients from healthy control. We also found Granulicatella and Proteus were enriched in patients who did not respond to neoadjuvant chemotherapy while E. Faecalis was enriched in responders. Additionally, we found 32% overlap between microbiota of urine and archival diagnostic tumor samples. Because bladder cancer patients undergoing surgical procedures are exposed to a single dose of peri-procedure antibiotics, we took advantage of a 'natural experiment' to measure microbial changes in urology patients receiving a single dose of antibiotics for skin procedures, finding that there are very few changes that persist for 1 month. Additionally, we measured microbial changes during BBN-induced carcinogenesis in a mouse model and observed that changes are more likely related to BBN exposure itself rather than carcinogenesis as changes induced by BBN resolve after BBN withdrawal. Lastly, urine from bladder cancer patients harbored abundant Gammaproteobacteria, which in cell culture experiments, detoxified gemcitabine, a commonly used therapy in bladder cancer.

Conclusions: In summary, we identify many new relationships between the microbiome and bladder cancer that are clinically relevant and lay the groundwork important functional studies in the future.

Keywords: 16S sequencing; BBN; bladder cancer; gemcitabine; microbiome; microbiota; urothelial carcinoma.


Conflict of interest statement

The authors declare that the research was conducted in the absence of any commercial or financial relationships that could be construed as a potential conflict of interest.

Figures

Figure 1
Figure 1
Analysis of TCGA data from bladder cancer cohort. (A) Viruses and bacteria were identified using Kraken. MRA, mean relative abundance; FDR-P, FDR-adjusted P value; T=tumor, known cancer-causing organism; = associated with response to immune checkpoint blocking therapies. = can detoxify gemcitabine. (B) Pearson analysis of OTUs from available replicates from TCGA samples were cross-validated to each other as a test of reproducibility. (C) Table listing specific taxa associated with clinical variables, tumor microenvironment and metabolic pathways. (D) mRNA expression levels of TP53, RB1 and CDKN2A demonstrating their gene expression profiles in HPV-positive versus HPV-negative tumors.
Figure 2
Figure 2
Effect of UPEC on gemcitabine cytotoxicity: (A) Cell micrographs depicting infection with E.coli. Hoechst = Nuclei; Phalloidin = Cytoplasm; UPEC (B) Cytotoxicity of gemcitabine was tested in 4 cell lines BBN, SW780, J82, and UMUC3 in the presence (red) and (absence) of infection with UPEC. IC50 values were calculated using GraphPad Prism. Data are expressed as mean ± SD from a representative of three independent experiments. (C) Results from colony formation assay in BBN, SW780, J82, and UMUC3 analyzing the colony forming ability of the cell lines when treated with 0.5x, 1x, or 2x IC50 concentrations of gemcitabine in the presence or absence of UPEC infection. On the right, crystal violet stain was dissolved and the resultant absorbance was measured at 600nm to quantify the results from the colony forming assay. Statistical significance was determined by Student’s t-test. (*p<0.05). (D) HPLC analysis of cell culture media containing gemcitabine alone (top), UPEC alone (middle) and gemcitabine incubated with UPEC for 1 hr (bottom). Gemcitabine (column 1) and dFdU (column 2) peaks were detected. (E) Mean relative abundance of gammaproteobacteria or other species in urine samples from bladder cancer patients prior to radical cystectomy. Each column represents a unique urine sample from an individual patient.
Figure 3
Figure 3
16S metagenomic analyses of urine pellets from bladder cancer patients and non-cancer controls. (A) A stacked bar plot showing bacterial composition at the genus level across samples from bladder cancer patients and non-cancer controls. (B) Genus-level alpha diversity plots of the urine microbiome from both groups with error bars representing variability in diversity scores (C) PCoA using weighted unifrac distances of beta diversity stratified by disease state (ADONIS; Bray-Curtis; p=0.0001) (D) Bar plot showing bacterial composition at the genus level. Relative abundance is plotted for taxa from each group. (E) Histogram of LDA scores for differentially over-abundant taxa in urine samples from bladder cancer (blue bars) and non-cancer controls (orange bars).
Figure 4
Figure 4
Analysis of urine microbiome differences in bladder cancer patients before and after receiving chemotherapy. (A) A stacked bar plot showing bacterial composition at the genus level across samples from bladder cancer patients pre- and post-chemotherapy. (B) Genus-level alpha diversity plots of the urine microbiome from both groups with error bars representing variability in diversity scores (C) PCoA using weighted unifrac distances of beta diversity stratified by treatment (ADONIS; Bray-Curtis; p=0.88) (D) Bar plot showing bacterial composition at the genus level. Relative abundance is plotted for taxa from each group. (E) Histogram of LDA scores for differentially abundant taxa in urine samples from bladder cancer patients pre- (blue bars) and post- (orange bars) chemotherapy.
Figure 5
Figure 5
Differences in urine microbiome between responders and non-responders to chemotherapy. (A) A stacked bar plot showing bacterial composition at the genus level across samples from responders and non-responders to chemotherapy (B) Genus-level alpha diversity plots of the urine microbiome from both groups with error bars representing variability in diversity scores (C) PCoA using weighted unifrac distances of beta diversity stratified by response to chemotherapy (ADONIS; Bray-Curtis; p=0.365) (D) Bar plot showing bacterial composition at the genus level. Relative abundance is plotted for taxa from each group. (E) Bar plots showing differential expression of taxa at genus level between responders and non-responders (F) Histogram of LDA scores for differentially over-abundant taxa in urine samples from responders (blue bars).
Figure 6
Figure 6
Effect of antibiotic treatment on the urine microbiome. (A) Genus-level alpha diversity plots of the urine microbiome from samples taken from healthy controls pre- and post antibiotic treatment with error bars representing variability in diversity scores (B) PCoA using weighted unifrac distances of beta diversity stratified by antibiotic treatment (ADONIS; Bray-Curtis; p=0.344) (C) Bar plot showing bacterial composition at the genus level. Relative abundance is plotted for taxa from each group. (D) Histogram of LDA scores for differentially over-abundant taxa in urine samples from urine samples pre-(blue bars) and post-antibiotic treatment (orange bars).
Figure 7
Figure 7
Variability in microbiome between urine and matched TURBT samples from bladder cancer patients. (A) Genus-level alpha diversity plots of the urine microbiome from urine samples and matched TURBT samples from bladder cancer patients with error bars representing variability in diversity scores (B) PCoA using weighted unifrac distances of beta diversity stratified by sample type (ADONIS; Bray-Curtis; p=0.0001) (C) Bar plot showing bacterial composition at the genus level. Relative abundance is plotted for taxa from each group. (D) Venn diagram showing number of shared and unique OTUs between urine and matched TURBT samples from the bladder cancer patients.
Figure 8
Figure 8
Microbiome alterations in mice over the course of tumor development: (A) Schematic showing treatments in the two groups of mice (B) µCT excretory urography images of mice demonstrating filling deficit indicated by yellow arrows in tumor-bearing mouse at week 16 (C) Shannon diversity plot depicting microbiome diversity at baseline, 6, 12 and post 16 weeks in both mice on water alone and with BBN treatment (D) PCoA using weighted unifrac distances of beta diversity stratified by timepoint (top) and by treatment (bottom) (ADONIS; Bray-Curtis; top, p<0.01; bottom, p<0.01) (E) Bar plot showing bacterial composition at the genus level in the 2 groups of mice (F) Histogram of LDA scores for differentially abundant taxa in tumor samples from water vs BBN mice at the post 16 weeks timepoint (top) and between post tumor BBN mice vs baseline (bottom). (G) Genus-level alpha diversity plots of TCGA samples compared to tumor samples taken at >16 weeks from mice treated with BBN with error bars representing variability in diversity scores (H) PCoA using weighted unifrac distances of beta diversity stratified by sample type (ADONIS; Bray-Curtis; p=0.0001) (I) Genus-level alpha diversity plots of TURBT samples compared to tumor samples taken at >16 weeks from mice treated with BBN with error bars representing variability in diversity scores (J) PCoA using weighted unifrac distances of beta diversity stratified by sample type (ADONIS; Bray-Curtis; p=0.0001) (K) Venn diagram illustrating the number of shared and unique operational taxonomic units (OTUs) between TCGA samples, TURBT samples, and tumor samples from mice treated with BBN.

Similar articles

References

    1. Goodman B, Gardner H. The microbiome and cancer. J Pathol. (2018) 244:667–76. doi: 10.1002/path.2018.244.issue-5 - DOI - PubMed
    1. Rajagopala SV, Vashee S, Oldfield LM, Suzuki Y, Venter JC, Telenti A, et al. The Human Microbiome and Cancer. Cancer Prev Res (Phila). (2017) 10:226–34. - PubMed
    1. Fulbright LE, Ellermann M, Arthur JC. The microbiome and the hallmarks of cancer. PloS Pathog. (2017) 13:e1006480. doi: 10.1371/journal.ppat.1006480, PMID: - DOI - PMC - PubMed
    1. Bukavina L, Isali I, Ginwala R, Sindhani M, Calaway A, Magee D, et al. Global Meta-analysis of Urine Microbiome: Colonization of Polycyclic Aromatic Hydrocarbon-degrading Bacteria Among Bladder Cancer Patients. Eur Urol oncology. (2023) 6:190–203. doi: 10.1016/j.euo.2023.02.004, PMID: - DOI - PubMed
    1. Fouts DE, Pieper R, Szpakowski S, Pohl H, Knoblach S, Suh MJ, et al. Integrated next-generation sequencing of 16S rDNA and metaproteomics differentiate the healthy urine microbiome from asymptomatic bacteriuria in neuropathic bladder associated with spinal cord injury. J Trans medicine. (2012) 10:174. doi: 10.1186/1479-5876-10-174, PMID: - DOI - PMC - PubMed

LinkOut - more resources