. 2025 Jul 21:15:1590216.
doi: 10.3389/fonc.2025.1590216. eCollection 2025.

Identification of novel molecular subtypes and construction of a prognostic signature via multi-omics analysis and machine learning in lung adenocarcinoma

Affiliations

Identification of novel molecular subtypes and construction of a prognostic signature via multi-omics analysis and machine learning in lung adenocarcinoma

Ke Ma et al. Front Oncol. .

Abstract

Introduction: The development of high-throughput sequencing technologies and targeted therapeutic strategies has significantly improved the prognosis of lung adenocarcinoma (LUAD) patients with sensitive gene mutations. However, patients harboring rare or no actionable mutations were rarely benefit from these targeted therapies. This study aimed to identify novel molecular subtypes and construct a prognostic signature to enhance the stratification of LUAD prognosis.

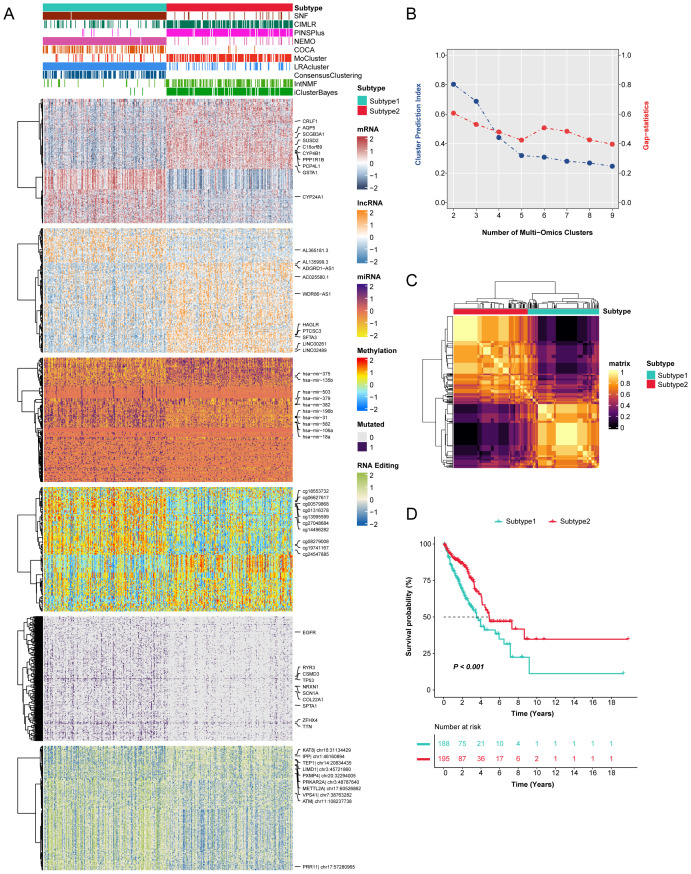
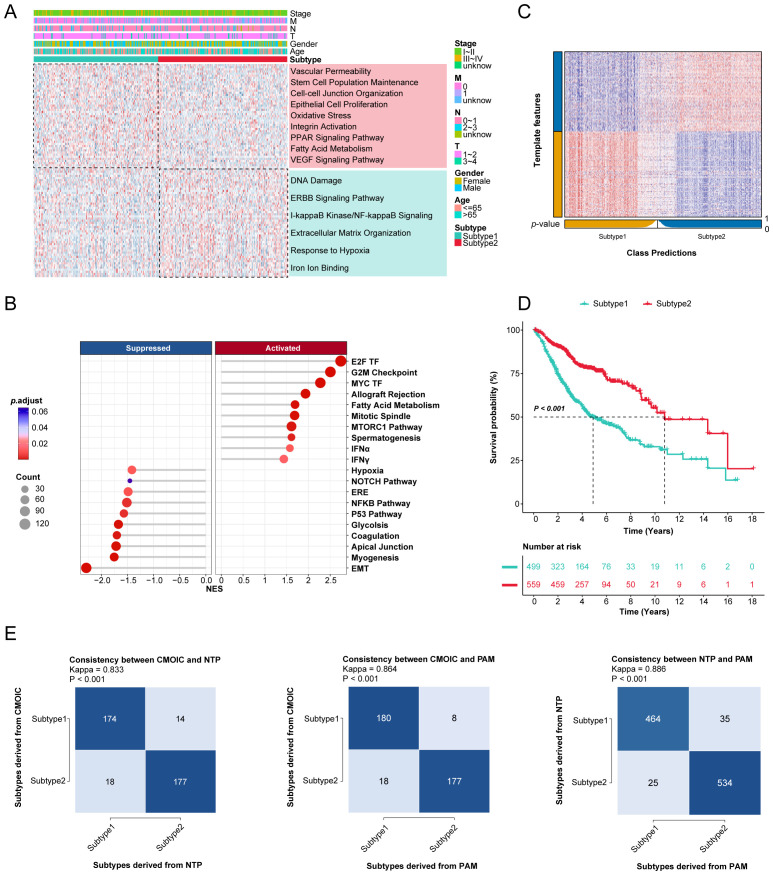
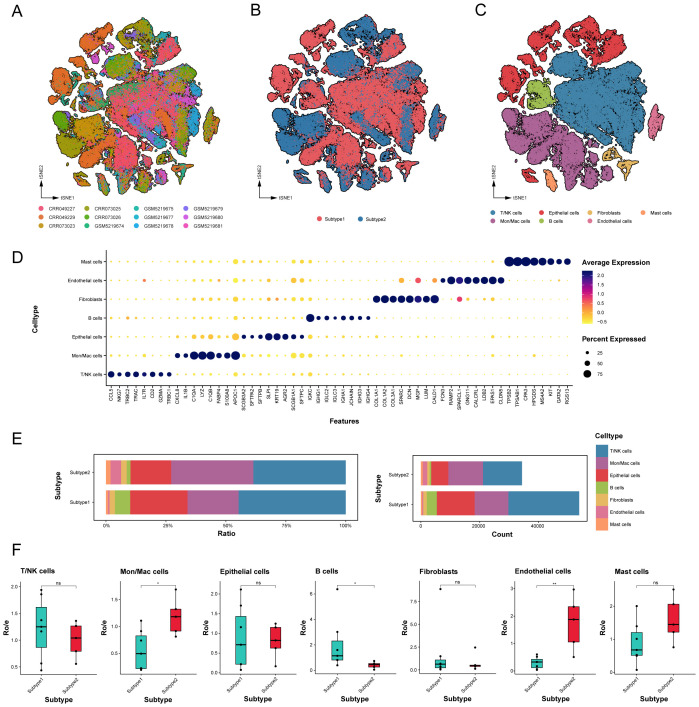
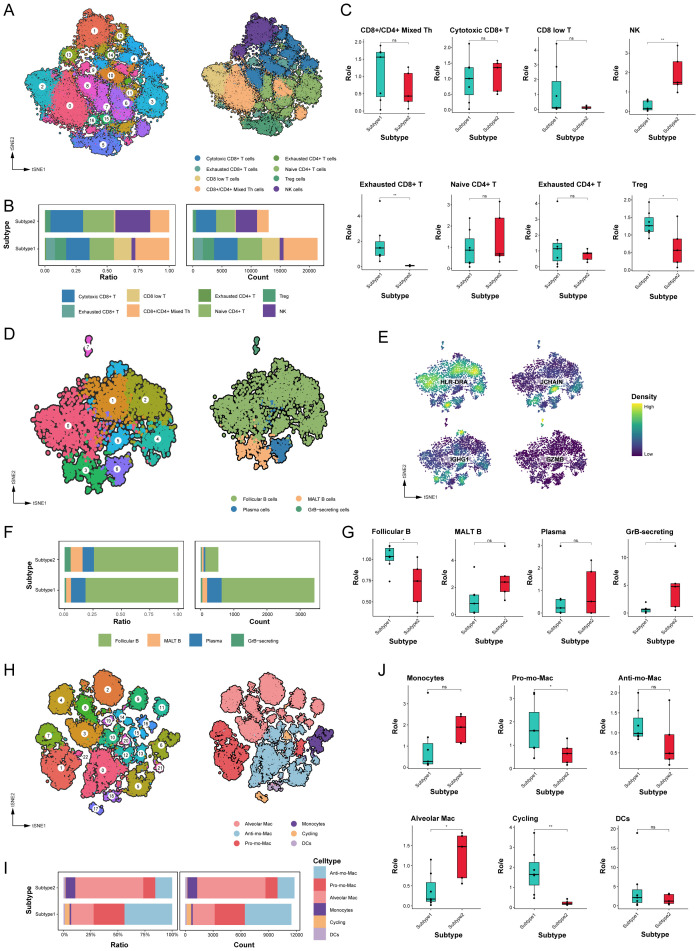
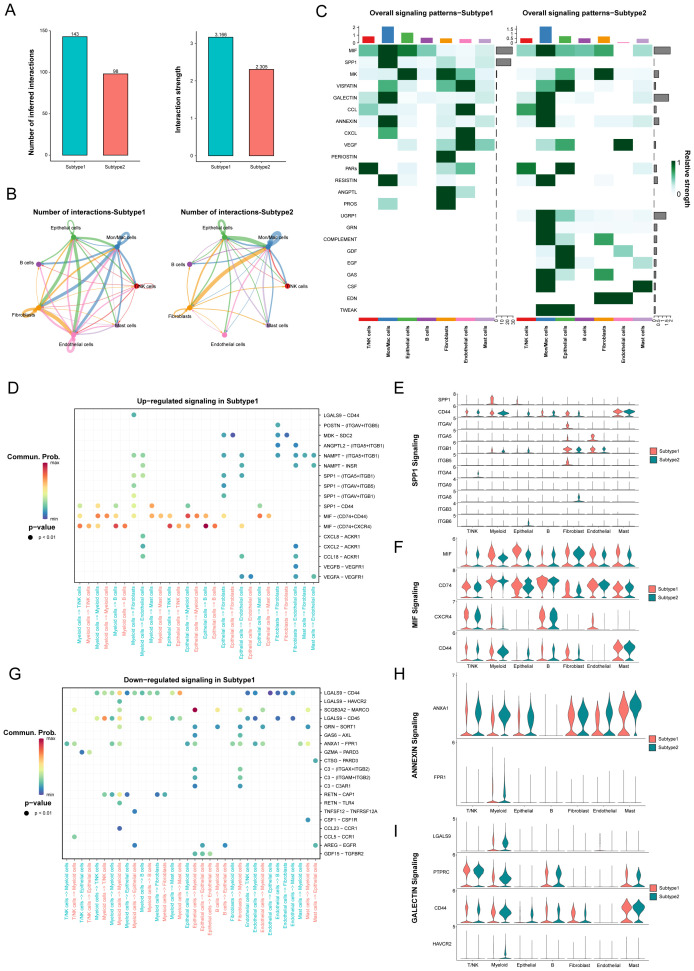
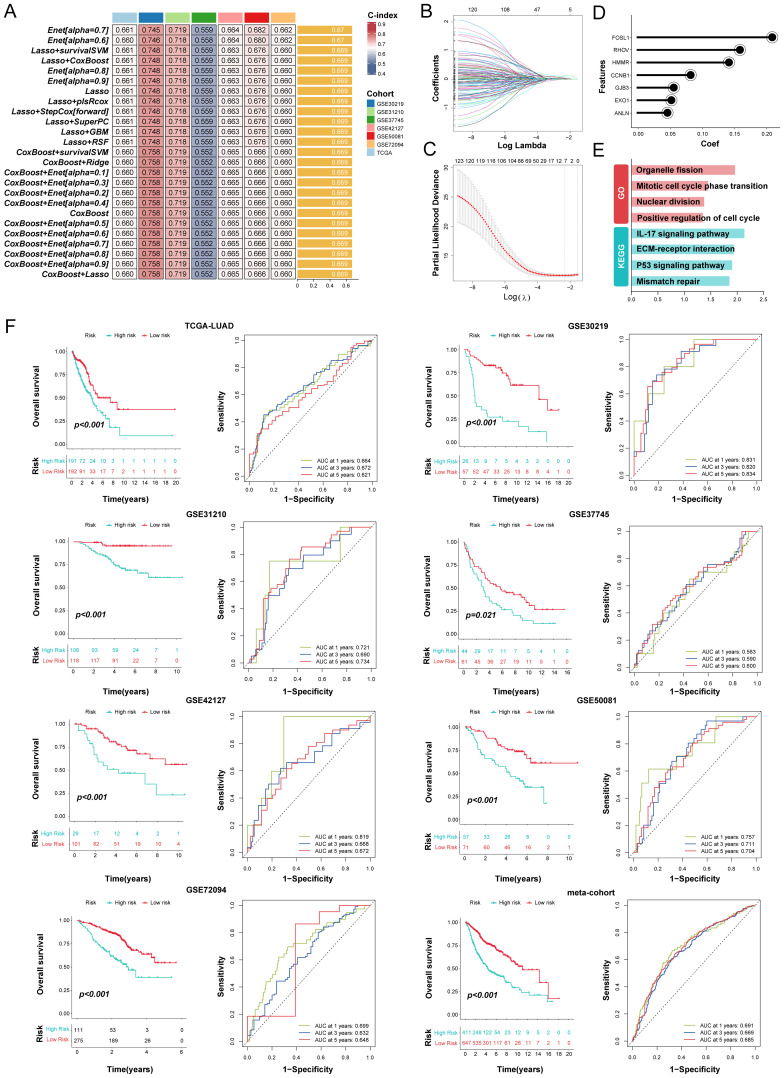
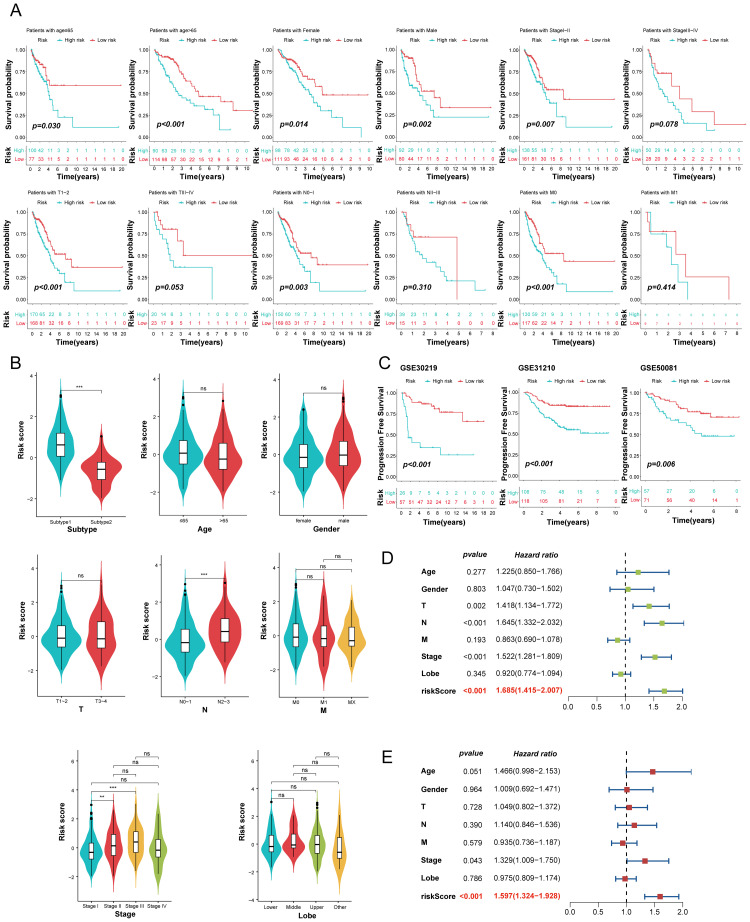
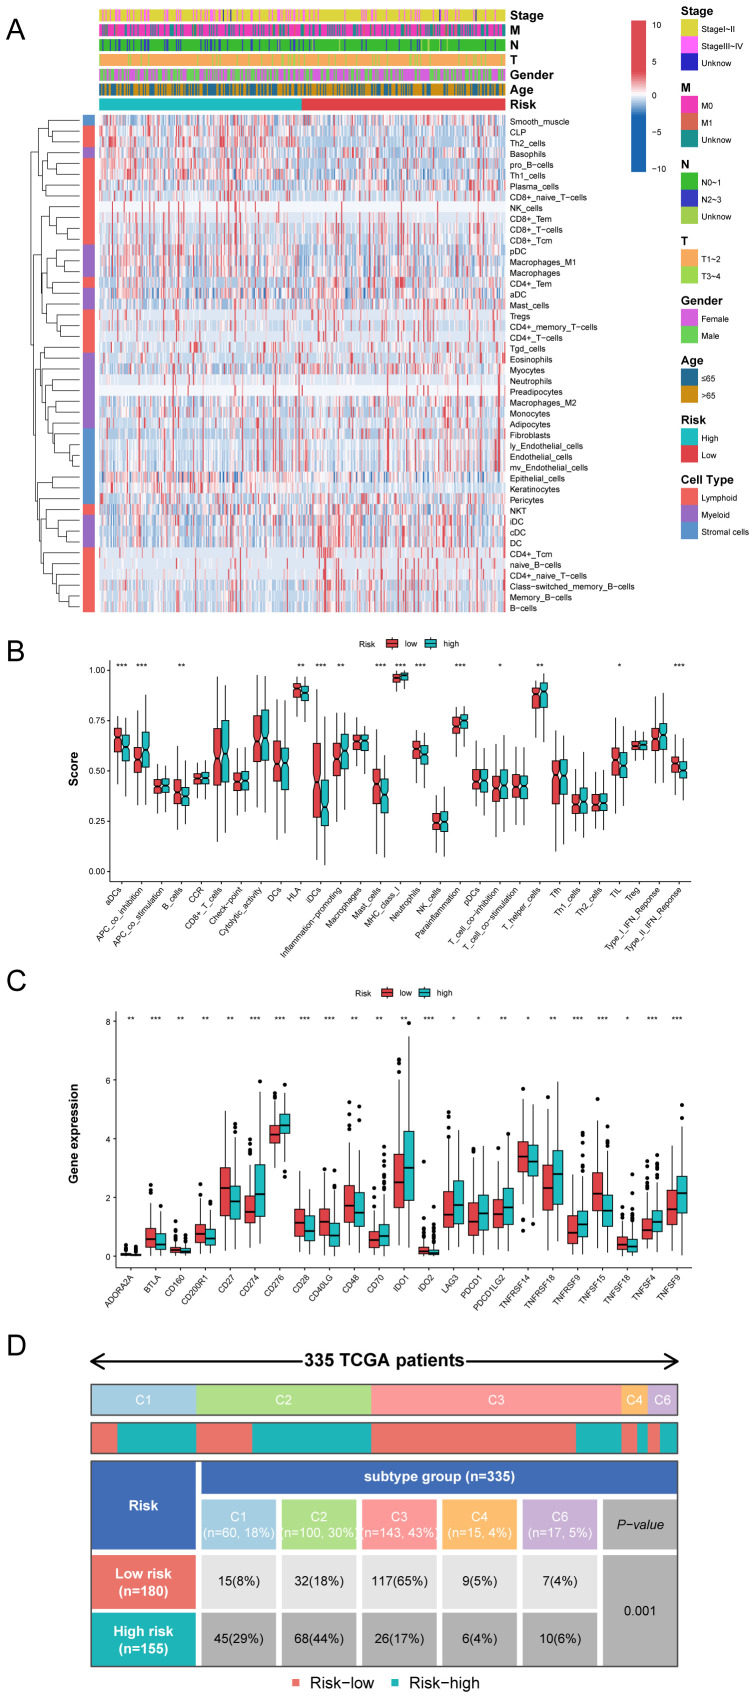
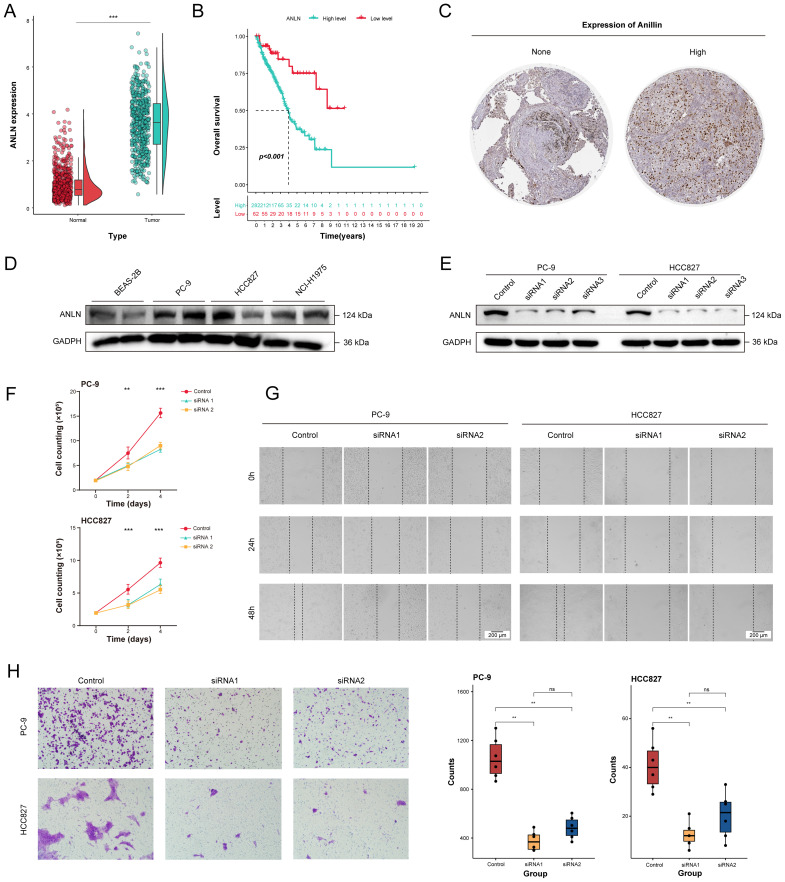
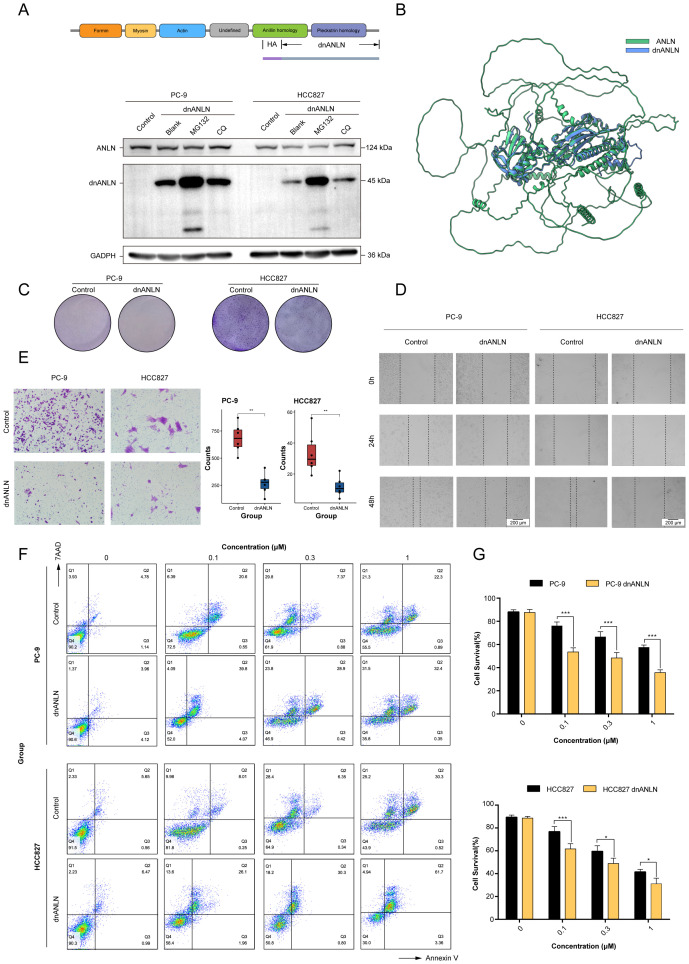
Materials and methods: Novel molecular subtypes of LUAD patients were identified by applying 10 distinct clustering algorithms on multi-omics data. Single-cell RNA-sequencing (scRNA-seq) data were integrated to characterize subtype-specific immune microenvironments. A multi-omics and machine learning-driven prognostic signature (MO-MLPS) was constructed in The Cancer Genome Atlas (TCGA) LUAD dataset using ten machine learning algorithms and subsequently validated across six independent datasets from the Gene Expression Omnibus (GEO) database. The robustness of the model was assessed using the concordance index (C-index), Kaplan-Meier survival analyses, receiver operating characteristic (ROC) curves, and both univariate and multivariate Cox regression analyses. We further confirmed the effects of ANLN knockdown and the expression of a domain-negative anillin protein (dnANLN) via western blotting, cell proliferation assays, flow cytometry, and transwell migration assays in vitro.

Results: Our analysis revealed that the novel molecular subtypes exhibited differences in prognoses, biological functions, and immune infiltration profiles in LUAD. The MO-MLPS was successfully established and validated across TCGA-LUAD cohorts, six independent GEO datasets, and their composite meta-cohort. Higher risk scores from the MO-MLPS correlated with poorer prognosis in LUAD, with AUC values exceeding 0.5 at 1, 3, and 5 years across various cohorts. The signature outperformed 49 previously published prognostic signatures. Furthermore, patients classified as high risk exhibited significantly worse overall and progression-free survival than those classified as low risk. Notably, ANLN knockdown and dnANLN expression significantly inhibited cell proliferation and migration in vitro and enhanced the efficacy of docetaxel.

Conclusion: A comprehensive analysis of multi-omics data redefines the molecular subtype of LUAD patients. The MO-MLPS derived from subtype characteristics has the potential to serve as a clinically valuable prognostic tool. Furthermore, ANLN emerges as a promising novel therapeutic target in the treatment of LUAD.

Keywords: lung adenocarcinoma; machine learning; multi-omics; prognostic signature; single-cell RNA sequencing.


Conflict of interest statement

The authors declare that the research was conducted in the absence of any commercial or financial relationships that could be construed as a potential conflict of interest.

Figures

Figure 1
Figure 1
The novel integrative consensus subtypes of LUAD identified through multi-omics analysis. (A) Comprehensive heatmap of novel integrative subtypes clustered through 10 cutting-edge multi-omics clustering algorithms in LUAD patients, including mRNA, lncRNA, miRNA, DNA methylation site, mutant gene and RNA editing event. (B) The cluster prediction index and gap statistical analysis of the multi-omics subtypes. (C) Consensus clustering matrix for two novel prognostic subtypes based on the 10 clustering methods. (D) Survival difference was observed among the two novel subtypes.
Figure 2
Figure 2
Gene enrichment analysis and validation of novel consensus subtypes in LUAD. (A) The GO and KEGG enrichment analyses of two consensus subtypes. (B) GSEA enrichment results of two consensus subtypes for hallmark repository. TF: transcription factor; MTORC: mechanistic target of rapamycin complex; IFN: interferon; ERE: estrogen response early; EMT: epithelial mesenchymal transition. (C) Validation of consensus subtypes in the nearest template of the integrated external validation cohort (n=1058). (D) Survival analysis of consensus subtypes in the integrated external validation cohort (n=1058). (E) The consistency of consensus subtypes with NTP, consensus subtypes with PAM, and NTP with PAM in external validation cohort (n=1058).
Figure 3
Figure 3
Global landscape and cell types in novel subtypes of LUAD samples. (A-C) tSNE projection of 88,100 profiled cells from 12 LUAD samples that have been identified into two novel subtypes, and color-coded by different samples, subtypes and major cell lineages. (D) Dot plot of mean expression of top 8 marker genes for 7 major lineages. (E) Relative proportion and count of cell major lineages for each subtype. (F) Tissue preference of each cell major lineages that were quantified by the calculation of the ratio of observed cell numbers to expected cell numbers (Ro/e) determined by a chi-square test. Black dots represent different samples. ns. p > 0.05; * p < 0.05; ** p < 0.01; two-sided Student’s t test.
Figure 4
Figure 4
The immune microenvironment varied significantly between different molecular subtypes. (A) tSNE plot of T and NK cells, color-coded by clusters and cell subsets as indicated. Tfh: T follicular helper; Th: T helper; Treg: Regulatory T. (B) Relative proportion and cell count of T and NK cells subsets from samples of each novel subtype. (C) Tissue preference of T and NK cells subsets. (D) tSNE plot of B cells, color-coded by clusters and cell subsets as indicated. GrB, granzyme B; MALT: mucosa-associated lymphoid tissue. (E) tSNE color-coded by expression of canonical marker genes for each B cells subset. (F) Relative proportion and cell count of B cells subsets from samples of each novel subtype. (G) Tissue preference of B cells subsets. (H) tSNE plot of myeloid cells, color-coded by clusters and cell subsets as indicated. Pro-: Pro-inflammatory; Anti-: Anti-inflammatory. (I) Relative proportion and cell count of myeloid cells subsets from samples of each novel subtype. (J) Tissue preference of myeloid cells subsets. ns. p > 0.05; * p < 0.05; ** p < 0.01; two-sided Student’s t test.
Figure 5
Figure 5
The difference of signaling pathways between two novel subtypes in LUAD. (A) The number of inferred interactions and the interaction strength between different molecular subtypes. (B) The number of inferred interactions for each subtype. (C) The overall signaling of each cell population between different subtypes. (D-I) Identification of up- and down-regulated signaling in the Subtype 1 through the comparison of communication probabilities mediated by ligand-receptor pairs in all cell populations.
Figure 6
Figure 6
Integration of multiple machine learning algorithms developed a prognostic signature in LUAD patients. (A) The top 25 kinds of prediction models based on a comprehensive computational framework and then the C-index of each model was calculated through training dataset and all validation datasets. (B, C) Coefficients of 7 prognosis-related genes selected by Enet [alpha = 0.7] regression. The regularization parameter λ is used to select covariates. (D) Lollipop plots displaying the coefficients of the MO-MLPS genes. (E) GO and KEGG term enrichment results of the MO-MLPS gene set. (F) Survival analysis and ROC curves for OS at 1-, 3-, and 5-years for all LUAD patients classified into high-risk and low-risk groups based on the MO-MLPS. The analysis includes data from the TCGA-LUAD (n = 383), GSE30219 (n = 83), GSE31210 (n = 226), GSE37745 (n = 105), GSE42127 (n = 130), GSE50081 (n = 128), GSE72094 (n = 386) cohorts, and a meta-cohort (n = 1058) for validation.
Figure 7
Figure 7
Evaluation of the MO-MLPS predictive power for the prognosis of LUAD patients. (A) Survival comparison analysis in different clinical subgroup of TCGA-LUAD cohort, including age, gender, AJCC stage and clinic stage. (B) Violin plots illustrated the relationship among the MO-MLPS high-risk and low-risk score in different clinical subgroup in TCGA-LUAD cohort, including subtype, age, gender, AJCC stage, clinic stage and lung lobe. (C) Kaplan-Meier analysis of progression-free survival of LUAD patients between the MO-MLPS high-risk and low-risk groups. (D, E) The univariate and multivariable Cox regression analysis results of the MO-MLPS in TCGA-LUAD cohort. Data are presented as mean ± 95% confidence interval [CI]. ns. p > 0.05; * p < 0.05; ** p < 0.01; *** p < 0.001; two-sided Student’s t test was used between two groups; one-way ANOVA test was used among multiple groups.
Figure 8
Figure 8
The immune microenvironment landscape in different the MO-MLPS risk group. (A) The relationship between the MO-MLPS risk score and immune microenvironment infiltrations in TCGA-LUAD dataset. (B, C) The distribution of 28 immune-related cell types and immune checkpoint genes between the MO-MLPS high-risk and low-risk patients. (D) 335 patients in the TCGA-LUAD cohort were accordingly divided into 5 different immune subtypes and each immune subtype were statistically different between the MO-MLPS high- and low-risk subgroups (P < 0.001).
Figure 9
Figure 9
The decrease of ANLN expression affected the proliferation and migration ability of human LUAD cells. (A) Differential expression analysis for ANLN between tumor tissues (n = 541) and normal tissues (n = 637) through integrating TCGA and GTEx database. (B) The Kaplan-Meier survival curves of the high- and low-expression ANLN groups in LUAD patients. (C) Representative Immunohistochemistry images showing the protein expressions of anillin. (D) The expression levels of anillin in BEAS-2B, PC-9, HCC827 and NCI-H1975 cell lines. (E) The effect of ANLN knockdown on anillin expression was measured by western blot analysis. (F) Cell proliferation evaluated by direct cell counting for ANLN knockdown in LUAD cells. (G, H) Representative images and statistical boxplots of migration ability of LUAD cell with ANLN knockdown assessed by scratch assay and transwell migration assay. ns. p > 0.05; * p < 0.05; ** p < 0.01; *** p < 0.001; two-sided Student’s t test was used between two groups; one-way ANOVA test was used among multiple groups.
Figure 10
Figure 10
The expression of recombinant dnANLN protein improved the sensitivity of LUAD cells to docetaxel treatment. (A) Schematic illustration of the dnANLN protein. And the levels of intracellular dnANLN protein expression were determined by western blot. The addition of MG132 affected the protein expression levels of dnANLN. CQ: chloroquine; dnANLN: domain negative anillin. (B) A tertiary structure prediction of dnANLN protein was generated using homology modeling method via the AlphaFold3 platform. (C) The colony formation assay was performed to assess the effect of dnANLN protein expression on colony-forming ability. (D, E) The evaluation of migration ability affected by the intracellular expression of dnANLN protein through scratch assay and transwell migration assay in LUAD cells. (F, G) The effect of dnANLN protein expression on the viability of LUAD cells subjected to docetaxel treatment. Cell viability of PC-9 and HCC827 were detected by flow cytometry using an Annexin V/7AAD assay. ns. p > 0.05; * p < 0.05; ** p < 0.01; *** p < 0.001; two-sided Student’s t test.

Similar articles

References

    1. Thai AA, Solomon BJ, Sequist LV, Gainor JF, Heist RS. Lung cancer. Lancet. (2021) 398:535–54. doi: 10.1016/s0140-6736(21)00312-3, PMID: - DOI - PubMed
    1. Li Y, Yan B, He S. Advances and challenges in the treatment of lung cancer. BioMed Pharmacother. (2023) 169:115891. doi: 10.1016/j.biopha.2023.115891, PMID: - DOI - PubMed
    1. Huang S, Yang J, Shen N, Xu Q, Zhao Q. Artificial intelligence in lung cancer diagnosis and prognosis: Current application and future perspective. Semin Cancer Biol. (2023) 89:30–7. doi: 10.1016/j.semcancer.2023.01.006, PMID: - DOI - PubMed
    1. Chen P, Liu Y, Wen Y, Zhou C. Non-small cell lung cancer in China. Cancer Commun (Lond). (2022) 42:937–70. doi: 10.1002/cac2.12359, PMID: - DOI - PMC - PubMed
    1. Riely GJ, Wood DE, Ettinger DS, Aisner DL, Akerley W, Bauman JR, et al. Non-small cell lung cancer, Version 4.2024, NCCN Clinical Practice Guidelines in Oncology. J Natl Compr Canc Netw. (2024) 22:249–74. doi: 10.6004/jnccn.2204.0023, PMID: - DOI - PubMed

LinkOut - more resources