

Exploring the effects of resveratrol and β-hydroxy-β-methylbutyric acid under different protein levels on the ileal health of tibetan sheep
- PMID: 40761281
- PMCID: PMC12319562
- DOI: 10.3389/fmicb.2025.1612170
Exploring the effects of resveratrol and β-hydroxy-β-methylbutyric acid under different protein levels on the ileal health of tibetan sheep
Abstract
Introduction: Resveratrol (RES) and β-hydroxy-β-methylbutyric acid (HMB) have been shown to improve growth performance in Tibetan sheep by regulating the gut microbiota. This study explored the effects of RES and HMB supplementation on the microbial composition and metabolite levels in the ileum of Tibetan sheep receiving diets with different protein levels.
Methods: In a 2 × 2 factorial arrangement, consisting of dietary protein levels (12% and 14%) and feed additive levels (no addition; and RES 1.50 g/d and HMB 1.25 g/d addition). A total of 120 healthy two-month-old male Tibetan lambs (16.87 ± 0.31) were randomly divided into 4 groups (n = 6): 12% protein level group (L), the 12% protein level supplemented with RES and HMB group (L-RES-HMB); the 14% protein level group (H); and the 14% protein level supplemented with RES and HMB group (H-RES-HMB).
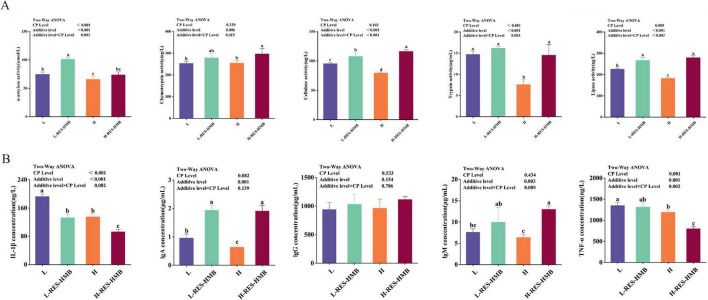
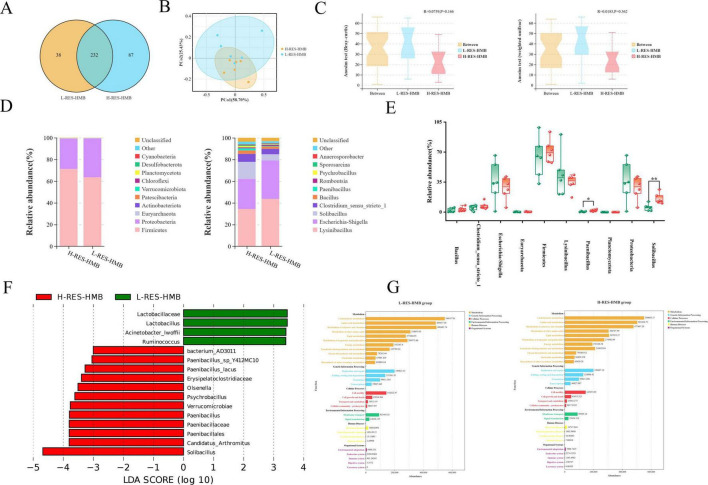
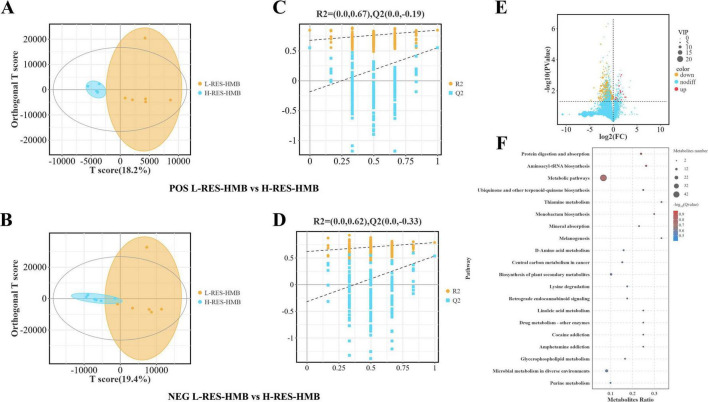
Results: The results demonstrated that the activities of digestive enzymes (β-amylase, trypsin, lipase, and cellulase), the levels of antibodies (IgA and IgM), and the contents of short-chain fatty acid (SCFA) (butyric acid) were significantly increased in the H-RES-HMB group (P < 0.05). Additionally, RES and HMB supplementation affected the morphology of ileum tissue, improving the villus height, crypt depth, and mucosal thickness (P < 0.05). Microbial analysis revealed that compared with the L-RES-HMB group, the H-RES-HMB group had a higher abundance of Planctomycetota, Solibacillus, and Paenibacillus (P < 0.05). Metabolomics analysis revealed a total of 229 significantly different metabolites, of which Irinotecan, Erdosteine thioacid, 4,4'-diaminodiphenylmethane, and Morphine N-oxide emerged as the key up-regulated metabolites. These differential metabolites were mainly enriched in pathways such as protein digestion and absorption, metabolic pathways, and mineral absorption.
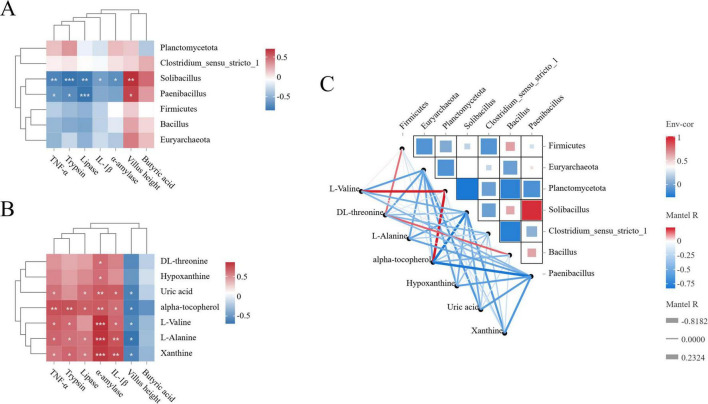
Discussion: Overall, when the dietary protein content was 14%, digestive enzyme activities, immune responses, and SCFAs levels in the ileum were improved, and the mucosal morphology of the ileum was enhanced. When the 14% protein diet was supplemented with RES and HMB, the concentration of butyric acid was increased. This increase was due to the regulation of the ileum microbiota (Firmicutes and Clostridium_sensu_stricto_1) and metabolites (xanthine and uric acid), which promoted the activities of digestive enzymes and immune responses and improved mucosal morphology in the ileum.
Keywords: Tibetan sheep; metabolomics; microbiota; resveratrol; β-hydroxy-β-methylbutyric acid.
Copyright © 2025 Gao, Zhu, Zhang, Saren, Zhang, Gan, Hou and Gui.
Conflict of interest statement
The authors declare that the research was conducted in the absence of any commercial or financial relationships that could be construed as a potential conflict of interest.
Figures

Similar articles
-
Transcriptomic and metabolomic insights into the synergistic effects of resveratrol and β-hydroxy-β-methylbutyric acid on hepatic function under varying protein diets in Tibetan sheep.Front Nutr. 2025 Jul 8;12:1614114. doi: 10.3389/fnut.2025.1614114. eCollection 2025. Front Nutr. 2025. PMID: 40697554 Free PMC article.
-
The influence of resveratrol and β-Hydroxy-β-methyl butyric acid supplementation alone or in combination on the development and health of the duodenum in Tibetan sheep.Front Microbiol. 2025 Jul 8;16:1612102. doi: 10.3389/fmicb.2025.1612102. eCollection 2025. Front Microbiol. 2025. PMID: 40698187 Free PMC article.
-
Resveratrol and β-hydroxy-β-methylbutyric acid supplementation promotes ileal development and digestive function by altering microbial community abundance and metabolites in Tibetan sheep.Front Vet Sci. 2024 Dec 11;11:1470992. doi: 10.3389/fvets.2024.1470992. eCollection 2024. Front Vet Sci. 2024. PMID: 39723186 Free PMC article.
-
Systemic treatments for metastatic cutaneous melanoma.Cochrane Database Syst Rev. 2018 Feb 6;2(2):CD011123. doi: 10.1002/14651858.CD011123.pub2. Cochrane Database Syst Rev. 2018. PMID: 29405038 Free PMC article.
-
Intravenous magnesium sulphate and sotalol for prevention of atrial fibrillation after coronary artery bypass surgery: a systematic review and economic evaluation.Health Technol Assess. 2008 Jun;12(28):iii-iv, ix-95. doi: 10.3310/hta12280. Health Technol Assess. 2008. PMID: 18547499
References
-
- Amoah K., Dong X.-H., Tan B.-P., Zhang S., Chi S.-Y., Yang Q.-H., et al. (2021). Effects of three probiotic strains (Bacillus coagulans, B. licheniformis and Paenibacillus polymyxa) on growth, immune response, gut morphology and microbiota, and resistance against Vibrio harveyi of northern whitings, Sillago sihama Forsskál (1775). Anim. Feed Sci. Technol. 277:114958. 10.1016/j.anifeedsci.2021.114958 - DOI
-
- Arazi H., Taati B., Suzuki K. (2018). A review of the effects of leucine metabolite (β-hydroxy-β-methylbutyrate) supplementation and resistance training on inflammatory markers: A new approach to oxidative stress and cardiovascular risk factors. Antioxidants 7:148. 10.3390/antiox7100148 - DOI - PMC - PubMed
LinkOut - more resources
Full Text Sources
Miscellaneous