. 2025 Jul 14;28(8):113114.
doi: 10.1016/j.isci.2025.113114. eCollection 2025 Aug 15.

In vitro metabolic interaction network of a rationally designed nasal microbiota community

Affiliations

In vitro metabolic interaction network of a rationally designed nasal microbiota community

Laura Bonillo-Lopez et al. iScience. .

Abstract

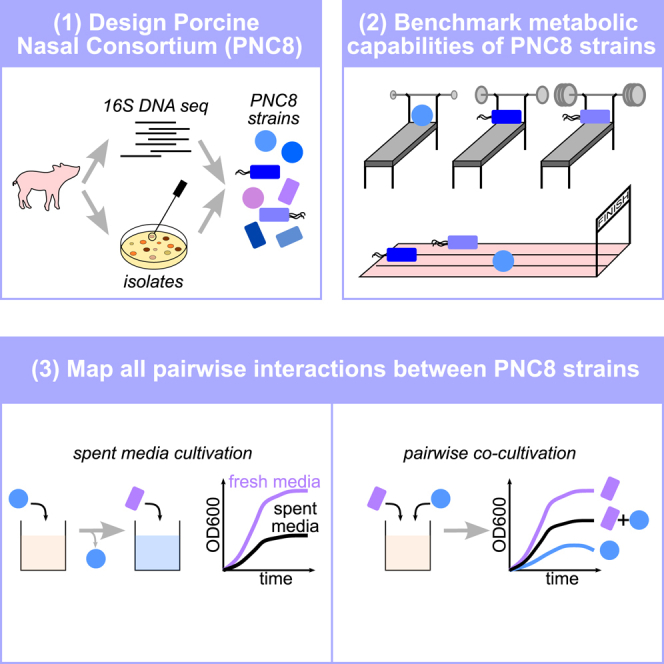
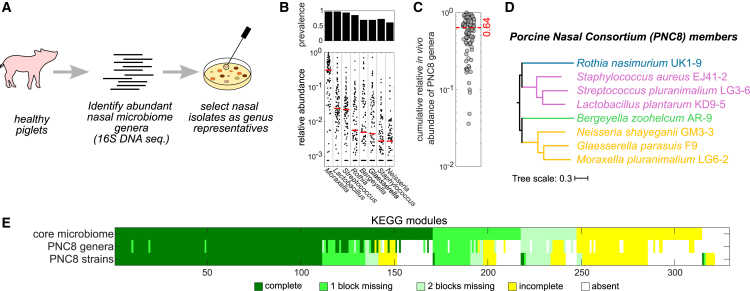
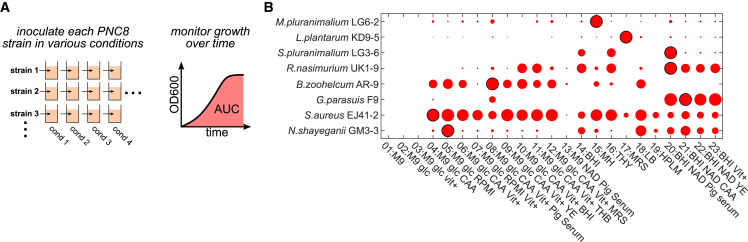
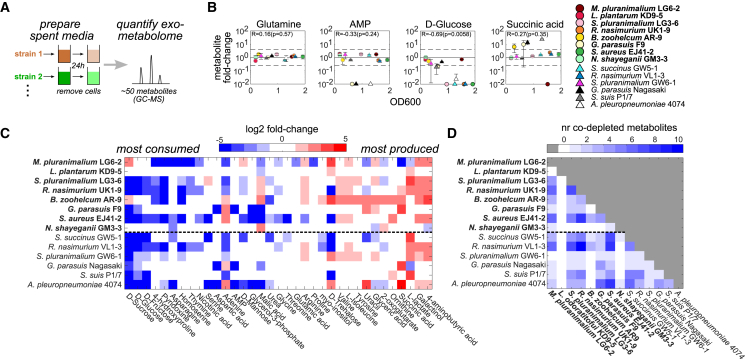
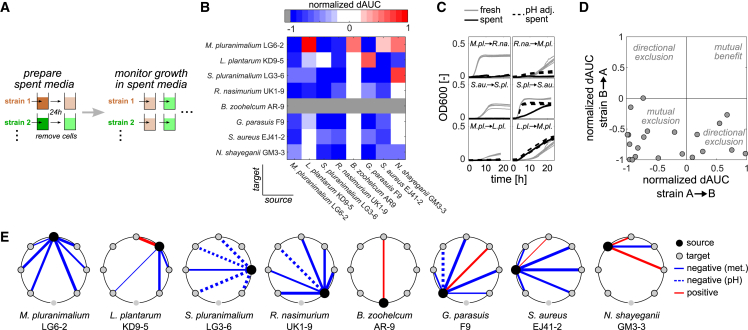
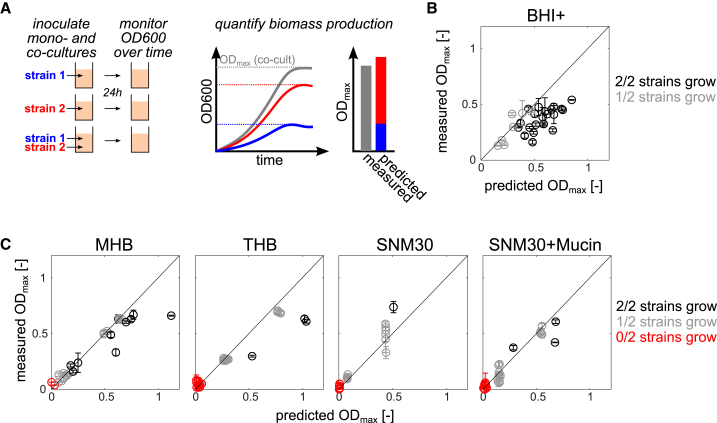
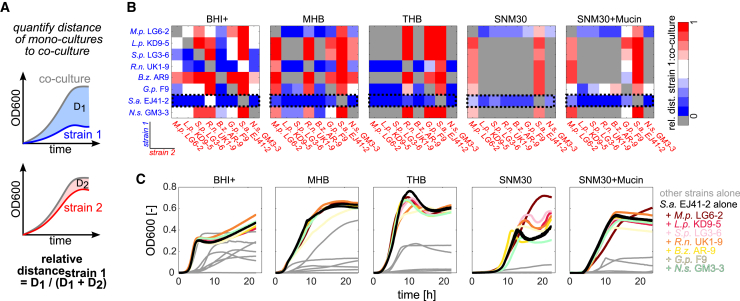
Mounting evidence suggests that metabolite exchange between microbiota members is a key driver of microbiota composition. However, we still know little about the metabolic interaction networks within many microbiota. To tackle this issue, we developed the porcine nasal consortium (PNC8), which represents the most in vivo abundant genera in the nasal microbiota of healthy piglets, and used it to systematically map the in vitro metabolic interactions between its members. Spent media experiments, exometabolomics, and direct co-cultivation, revealed that most pairwise interactions between PNC8 strains are negative, with co-depletion of sugars acting as a key driver. This prevalence of negative interactions leads to a complex competition hierarchy in which only few strains are able to consistently outcompete all others. Overall, this work provides a valuable resource for studying the nasal microbiota under experimentally tractable in vitro conditions and is a key step toward mapping its metabolic interaction network.

Keywords: metabolomics; microbiome.


Conflict of interest statement

The authors declare no conflict of interest.

Figures

None
Graphical abstract
Figure 1
Figure 1
Development of the porcine nasal consortium (PNC8) (A) Schematic of approach to rationally design the PNC8 consortium. (B) Prevalence (fraction of samples with relative abundance >0.1%, top) and relative abundance (bottom) of the eight most abundant genera (sorted by median abundance across samples, shown as red horizontal lines) in 94 healthy piglets as determined by 16S sequencing. Each circle denotes an individual animal. (C) Summed in vivo relative abundance of PNC8 genera (dashed line denotes median: 64%). Each circle denotes an individual animal. (D) Phylogenetic tree of PNC8 members. PNC8 members are color-coded by phylum (purple: Firmicutes, green: Bacteroidota, blue: Actinobacteria, orange: Proteobacteria). (E) Comparison of inferred KEGG completeness within in vivo samples (KEGG modules were inferred from 16S ASVs using core nasal microbiota or only PNC8 genera as described in the STAR Methods section, top and middle rows), and the combined PNC8 strains (KEGG modules were extracted directly from the genomic sequences of these strains, bottom row). To aid visual comparison KEGG modules were sorted according to completeness first for core nasal microbiota, and then for PNC8 strains.
Figure 2
Figure 2
Growth patterns of PNC8 members across various in vitro conditions (A) Schematic of approach. (B) Area-under-growth-curve (AUC, shown here as circle size) of PNC8 members in 23 different cultivation media (normalized to the condition with maximal AUC for each PNC8 member, which is denoted with a black edge). See Figure S3 for the underlying growth curves.
Figure 3
Figure 3
Metabolite usage patterns of nasal microbiota members (A) Schematic of experimental design. (B) Example data, shown here as metabolite fold-changes (compared to fresh media) plotted against the mean OD600 reached in the respective spent-media culture. Error bars denote standard deviation (n = two replicate cultures grown in parallel). Horizontal dashed lines denote a 4-fold change (used to determine depleted/produced metabolites in C and D). R and p denote the Spearman correlation coefficient and corresponding p value between metabolite fold-changes and OD600. Data points with a metabolite fold-change below 10−2 were set to 10−2. See Figure S6 for all other metabolites. (C) Metabolites sorted from most consumed (i.e., used as substrate by most strains) to most produced (used as product by most strains). Data shown are log2 fold-change compared to fresh media (average of two replicate cultures grown in parallel). Unused metabolites (abs(fold-change) < 4 in all tested strains) are not shown. Bold strain names: PNC8 strains. Data shown: average of two replicate cultures. (D) Number of co-depleted metabolites (>4-fold decrease compared to fresh media) for all tested strain pairs. Bold strain names: PNC8 strains.
Figure 4
Figure 4
Identifying directional metabolic interactions between PNC8 strains using spent-media growth experiments (A) Schematic of experimental approach. (B) Normalized difference in area-under-the-growth-curves (dAUC). Normalized dAUC = (AUCspent—AUCfresh)/AUCfresh for all PNC8 strains. Negative normalized dAUC values denote cases where a strain grows more poorly in a spent media compared to fresh media. Data show mean of 2–3 replicate cultures grown in parallel. (C) Example growth curves (shown from source → target strain). Each curve denotes an individual replicate curve (n = 2–3 for spent media, n = 6 for fresh media). (D) Same data as in (B), but plotted to highlight directional impact in each strain pair. (E) Pairwise interaction maps extracted from growth patterns in spent media, shown separately for each PNC8 strain as a source. Line thickness denotes the interaction strength (weak interactions with dAUC between −0.25 and 0.25 were omitted). Interactions were labeled as pH-driven (dashed lines) if the difference in dAUC between normal and pH-adjusted spent media exceeded 0.55. Note that B. zoohelcum AR-9 grew neither in fresh nor in spent media and was therefore omitted from the analysis. See Figure S8 for the underlying growth curves.
Figure 5
Figure 5
Identifying instances of metabolite competition between PNC8 using direct co-cultivation assays (A) Schematic of approach. (B) Predicted (from individual strains) and measured maximal OD600 of all 28 possible PNC8 co-cultivation pairs in BHI+. Predicted OD600 is calculated for each strain pair by summing the maximal OD600 values obtained for each individual strain grown in isolation. (C) Predicted and measured maximal OD600 of all co-cultivation pairs in four additional conditions. Black: Both strains grow in isolation (defined here as maximal OD600 > 0.1). Gray: only one of the two strains grows in isolation. Red: neither of the two strains grows in isolation. Error bars denote standard deviation (from two replicate cultures grown in parallel). See Figure S12 for the underlying growth curves.
Figure 6
Figure 6
Inferring pairwise competition hierarchy in PNC8 pairwise co-cultures by comparing mono- and co-culture growth curves (A) Schematic of analysis approach. (B) Relative distance of the growth curve of strain 1 to the co-culture growth curve (calculated as described schematically in A) for all strain pairs and conditions. Data shown: mean relative distances across replicates (n = 2). Only pairs in which at least one of the strains grew were considered (the rest is shown in gray). Black boxes with dashed outline: Example strain highlighted in next panel. (C) Example growth curves for co-cultures including S. aureus EJ41-2 across all tested conditions. Black line: growth curve of S. aureus EJ41-2 alone. Colored lines: co-culture growth curves of EJ41-2 and other PNC8 strains. Gray lines: growth curves of other PNC8 strains in isolation. Data show the mean of two replicate cultures grown in parallel.

Similar articles

References

    1. Marchesi J.R., Ravel J. The vocabulary of microbiome research: a proposal. Microbiome. 2015;3 - PMC - PubMed
    1. Osbelt L., Wende M., Almási É., Derksen E., Muthukumarasamy U., Lesker T.R., Galvez E.J.C., Pils M.C., Schalk E., Chhatwal P., et al. Klebsiella oxytoca causes colonization resistance against multidrug-resistant K. pneumoniae in the gut via cooperative carbohydrate competition. Cell Host Microbe. 2021;29:1663–1679.e7. - PubMed
    1. Eberl C., Weiss A.S., Jochum L.M., Durai Raj A.C., Ring D., Hussain S., Herp S., Meng C., Kleigrewe K., Gigl M., et al. E. coli enhance colonization resistance against Salmonella Typhimurium by competing for galactitol, a context-dependent limiting carbon source. Cell Host Microbe. 2021;29:1680–1692.e7. - PubMed
    1. Spragge F., Bakkeren E., Jahn M.T., B N Araujo E., Pearson C.F., Wang X., Pankhurst L., Cunrath O., Foster K.R. Microbiome diversity protects against pathogens by nutrient blocking. Science. 2023;382 - PMC - PubMed
    1. Isaac S., Flor-Duro A., Carruana G., Puchades-Carrasco L., Quirant A., Lopez-Nogueroles M., Pineda-Lucena A., Garcia-Garcera M., Ubeda C. Microbiome-mediated fructose depletion restricts murine gut colonization by vancomycin-resistant Enterococcus. Nat. Commun. 2022;13:7718. - PMC - PubMed

LinkOut - more resources