. 2025 Aug 4:6:0166.
doi: 10.34133/bmef.0166. eCollection 2025.

Decellularized Adipose Matrix Rejuvenates Photoaged Skin through Immune Microenvironment Modulation

Affiliations

Decellularized Adipose Matrix Rejuvenates Photoaged Skin through Immune Microenvironment Modulation

Jialiang Zhou et al. BME Front. .

Abstract

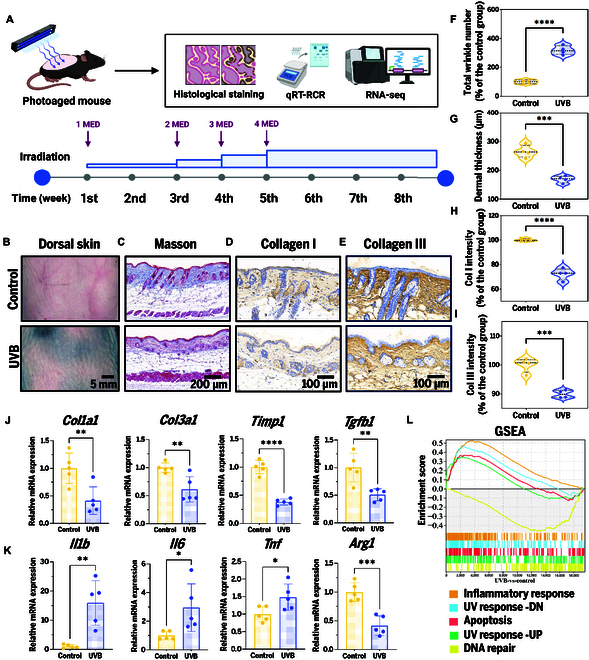
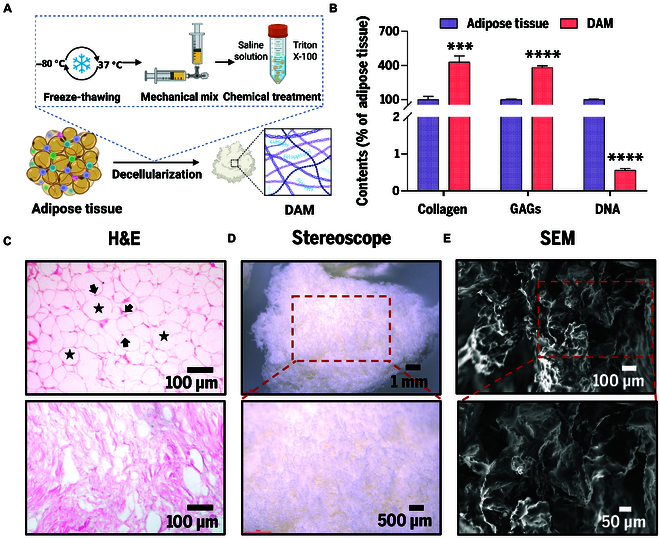
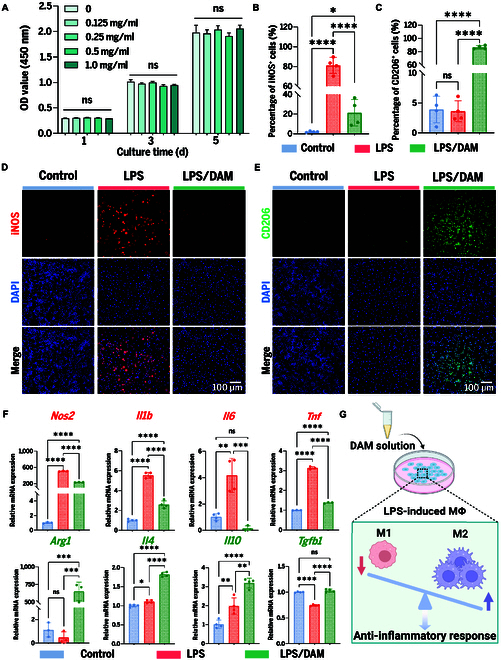
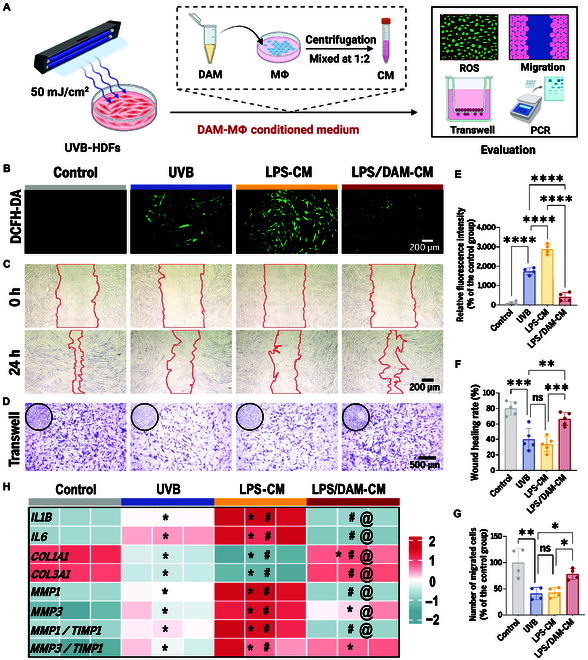
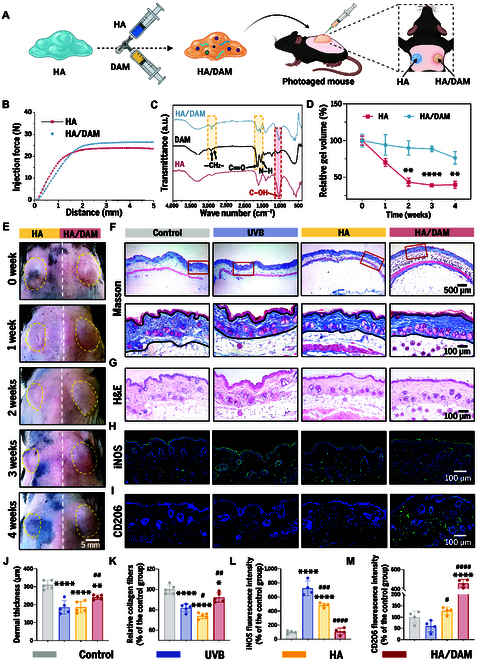
Objective: This study aims to explore the therapeutic potential of decellularized adipose matrix (DAM) in rejuvenating photoaged skin by modulating the immune microenvironment. Impact Statement: DAM effectively induces M1 to M2 macrophage polarization and rescues the function of photoaged fibroblasts through paracrine mechanisms, providing a novel strategy for skin antiaging through immune microenvironment remodeling. Introduction: Photoaging, triggered by prolonged ultraviolet exposure, is marked by the depletion of skin structural elements and a persistent inflammatory environment. Current clinical interventions primarily target structural defects, while immune modulation remains underexplored. Therefore, developing biomaterials with both extracellular matrix (ECM) replenishment and immune regulatory functions is crucial for skin regeneration. Methods: A photoaged mouse model was established using ultraviolet B irradiation to validate the inflammatory microenvironment. DAM was prepared via physicochemical decellularization and assessed in vitro for its effects on macrophage polarization and macrophage-fibroblast cross-talk. A DAM-functionalized hyaluronic acid (HA/DAM) hydrogel was developed and evaluated for its effects on skin rejuvenation via subcutaneous injection. Results: In vitro experiments demonstrated that DAM substantially promoted M2 macrophage polarization, and M2-macrophage-conditioned medium further improved fibroblast functions, including oxidative stress resistance, migration, and ECM synthesis. In vivo, HA/DAM hydrogel not only increased dermal thickness and collagen density but also restructured the immune microenvironment through M2 macrophage polarization. Conclusion: DAM offers a novel therapeutic approach for skin rejuvenation by modulating the immune microenvironment, demonstrating notable clinical potential.


Conflict of interest statement

Competing interests: The authors declare that they have no competing interests.

Figures

Fig. 1.
Fig. 1.
UVB irradiation induces inflammatory microenvironment in skin photoaging. (A) Modeling procedure and UVR intensity. (B) Macroscopic images. Scale bar, 5 mm. (C) Masson’s trichrome staining images. Scale bar, 200 μm. (D) IHC staining images of collagen I. Scale bar, 100 μm. (E) IHC staining images of collagen III. Scale bar, 100 μm. Statistical analysis of (F) total wrinkle number, (G) dermal thickness, (H) collagen I (col I) intensity, and (I) collagen III (col III) intensity. (J) qRT-PCR results related to ECM synthesis. (K) qRT-PCR results related to inflammation. *P < 0.05; **P < 0.01; ***P < 0.001; ****P < 0.0001. (L) GSEA. DN, down-regulated; UP, up-regulated.
Fig. 2.
Fig. 2.
Preparation and characterization of DAM. (A) Illustration of preparation procedures. (B) Relative contents of collagen, GAGs, and DNA in DAM and original adipose tissues, with original adipose tissues set as 100% for comparison. ***P < 0.001; ****P < 0.0001. (C) H&E staining images (arrows indicate cell nuclei; stars denote lipid droplets). Scale bars, 100 μm. (D) Optical images. Scale bars, 1 mm (overview) and 500 μm (detailed view). (E) SEM images. Scale bars, 100 μm (overview) and 50 μm (detailed view).
Fig. 3.
Fig. 3.
In vitro evaluation of DAM-mediated inflammatory modulation. (A) Proliferation of RAW264.7 cells treated with DAM. OD, optical density. (B) Analysis of iNOS-positive cells. (C) Analysis of CD206-positive cells. *P < 0.05; ****P < 0.0001. (D) Immunofluorescence images of iNOS staining. Scale bar, 100 μm. (E) Immunofluorescence images of CD206 staining. Scale bar, 100 μm. (F) qRT-PCR analysis of proinflammatory and anti-inflammatory cytokine mRNA levels. *P < 0.05; **P < 0.01; ***P < 0.001; ****P < 0.0001. (G) Illustration of the mechanism of DAM-mediated inflammatory modulation. MΦ, macrophage.
Fig. 4.
Fig. 4.
DAM enhances fibroblast function via macrophage CM. (A) Diagram depicting the photoaging HDF model, preparation of CM, and experimental evaluation. (B) Fluorescence images of intracellular ROS. Scale bar, 200 μm. (C) Images of wound healing assays. Scale bar, 200 μm. (D) Images of Transwell migration assays. Scale bar, 500 μm. (E) Quantification of relative ROS intensity. (F) Quantification of wound healing rates. (G) Quantification of relative migrated cells. *P < 0.05; **P < 0.01; ***P < 0.001; ****P < 0.0001. (H) qRT-PCR analysis of inflammation and ECM metabolism-related gene expression. *P < 0.05 versus control; #P < 0.05 versus UVB; @P < 0.05 versus LPS-CM (one-way ANOVA with Tukey’s post hoc test).
Fig. 5.
Fig. 5.
Therapeutic effects of DAM-functionalized hydrogel in photoaging mouse models. (A) Illustration of DAM-functionalized hydrogel preparation and injection. (B) Evaluation of injection force. (C) FTIR spectra of HA, DAM, and HA/DAM. a.u., arbitrary units. (D) Quantitative comparison of in vivo degradation kinetics between HA and HA/DAM hydrogels. **P < 0.01; ****P < 0.0001. (E) Photographs of injection regions. Scale bar, 5 mm. (F) Masson’s trichrome staining images. Scale bars, 500 μm (overview) and 100 μm (detailed view). (G) H&E staining images. Scale bar, 100 μm. (H) Immunofluorescence staining images of iNOS. Scale bar, 100 μm. (I) Immunofluorescence staining images of CD206. Scale bar, 100 μm. (J) Quantification of dermal thickness. (K) Quantification of relative collagen fibers density. (L) Quantification of iNOS signal intensity. (M) Quantification of CD206 signal intensity. In quantitative analyses, * and # denote significance versus the control and UVB groups, respectively. * and #, P < 0.05; ** and ##, P < 0.01; ###, P < 0.001; **** or ####, P < 0.0001.
Fig. 6.
Fig. 6.
Representative H&E staining images of major organs in different groups. Scale bar, 100 μm.

Similar articles

References

    1. Gordon JRS, Brieva JC. Images in clinical medicine. Unilateral dermatoheliosis. N Engl J Med. 2012;366(16): Article e25. - PubMed
    1. Yaar M, Gilchrest BA. Photoageing: Mechanism, prevention and therapy. Br J Dermatol. 2007;157(5):874–887. - PubMed
    1. Green AC, Hughes MCB, McBride P, Fourtanier A. Factors associated with premature skin aging (photoaging) before the age of 55: A population-based study. Dermatology. 2011;222(1):74–80. - PubMed
    1. Green AC. Premature ageing of the skin in a Queensland population. Med J Aust. 1991;155(7):473–474. - PubMed
    1. Pega F, Momen NC, Streicher KN, Leon-Roux M, Neupane S, Schubauer-Berigan MK, Schüz J, Technical Advisory Group on Occupational Burden of Disease Estimation, Baker M, Driscoll T, et al. Global, regional and national burdens of non-melanoma skin cancer attributable to occupational exposure to solar ultraviolet radiation for 183 countries, 2000–2019: A systematic analysis from the WHO/ILO joint estimates of the work-related burden of disease and injury. Environ Int. 2023;181: Article 108226. - PubMed

LinkOut - more resources