

Global patterns and drivers of species and genera richness of Fabaceae
- PMID: 40761565
- PMCID: PMC12319032
- DOI: 10.3389/fpls.2025.1581814
Global patterns and drivers of species and genera richness of Fabaceae
Abstract
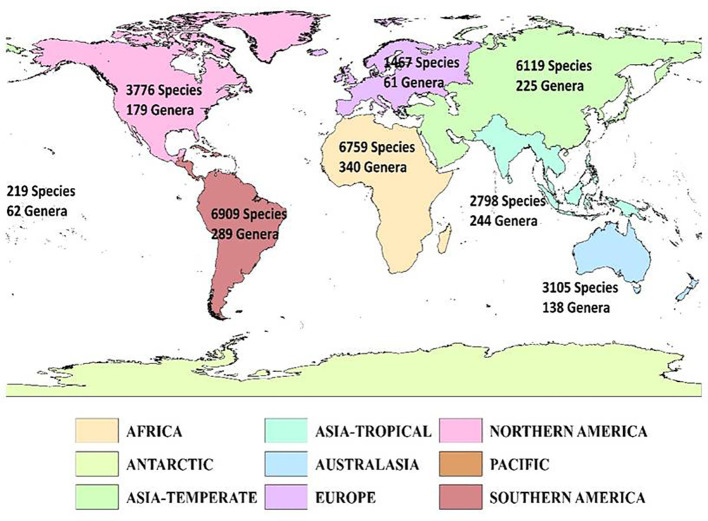
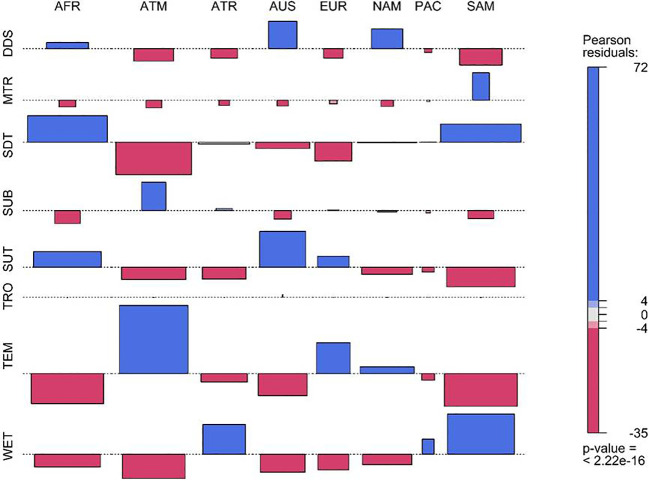
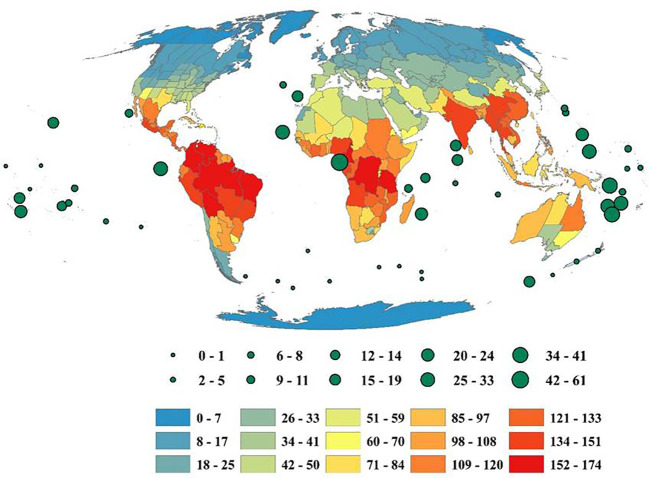
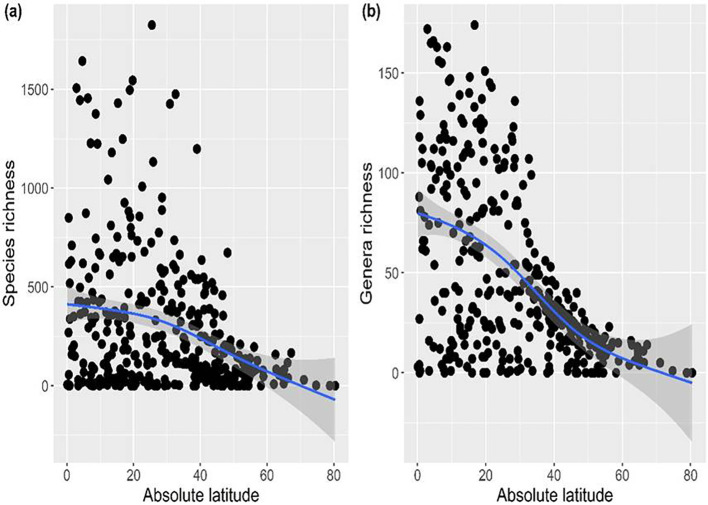
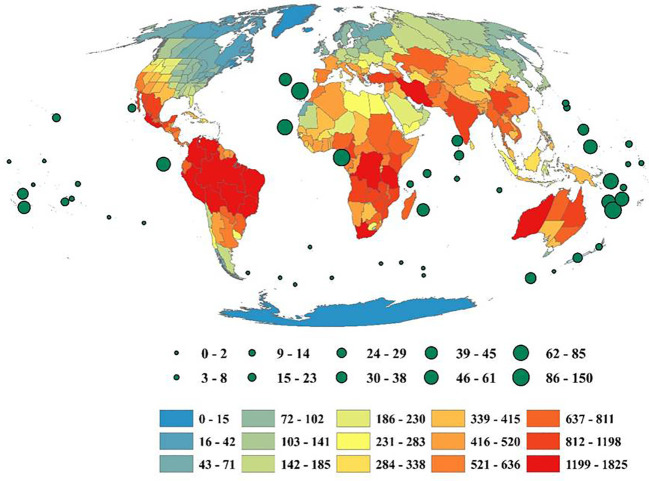
The Fabaceae, a highly diverse and ecologically vital plant family, thrives across diverse biomes with remarkable nitrogen-fixation potential and functional adaptability. Despite its key role in global carbon and nitrogen cycles, the biogeographic patterns and environmental drivers of this important family remain understudied compared to other major angiosperm families. Here, we consolidate and curate a global dataset comprising 27,421 taxa of Fabaceae obtained from the World Checklist of Vascular Plants (WCVP) and the Global Inventory of Floras and Traits (GIFT) to investigate the geographical patterns of species and genera richness and their environmental determinants. Using generalized linear models with a negative binomial approach and hierarchical partitioning analysis, we assessed the influence of climatic, geographic, and topographic predictors derived from WorldClim and PaleoClim on the species and genera richness of Fabaceae. The results reveal heterogeneous patterns of species and genera richness of Fabaceae, with maximum richness centers in tropical regions, particularly in seasonally dry tropical biomes, followed by temperate and subtropical biomes. Across the globe, Southern America turns out to be the dominant source of this botanical family, followed by Africa and Asia-Temperate. The results also reveal unequal representation of species belonging to different biomes in different continents. I found different sets of climatic and geographic drivers that shape the taxonomic levels of Fabaceae across countries, with a maximum contribution of elevation range, temperature diurnal range, precipitation seasonality, annual mean temperature, temperature seasonality, and geographical area. The findings provide data-based evidence of climatic variability and topographic heterogeneity in influencing the patterns of species and genera richness by enhancing niche differentiation and microhabitat diversity. The results concur with the latitudinal diversity gradient and the tropical conservatism hypothesis, which posits that stable tropical environments promote high species diversification and persistence. The present study will serve as a model to be replicated in other families to bridge the existing knowledge gaps. Furthermore, the findings of this study will aid in understanding the ecological adaptations of Fabaceae, which have immediate implications for ecological restoration and sustainable management strategies.
Keywords: Fabaceae; biogeography; drivers; global patterns; species richness.
Copyright © 2025 Siddiqui.
Conflict of interest statement
The author declares that the research was conducted in the absence of any commercial or financial relationships that could be construed as a potential conflict of interest.
Figures
References
-
- Arnold T. W. (2010). Uninformative parameters and model selection using Akaike's Information Criterion. J. Wildl. Manage. 74 (6), 1175–1178. doi: 10.1111/j.1937-2817.2010.tb01236.x - DOI
-
- Barton K. (2020). MuMIn: Multi-Model Inference. R package version 1.43.17. Available online at: https://CRAN.R-project.org/package=MuMIn (Accessed February 16, 2025).
-
- Baselga A. (2010). Partitioning the turnover and nestedness components of beta diversity. Global Ecol. biogeography 19, 134–143. doi: 10.1111/j.1466-8238.2009.00490.x - DOI
LinkOut - more resources
Full Text Sources