. 2025 Jan 22;12(2):93-104.
doi: 10.1093/jhps/hnaf001. eCollection 2025 Jul.

Weight-bearing CT as an approach to assess femoral-acetabular displacement during external rotation stress in the hip

Affiliations

Weight-bearing CT as an approach to assess femoral-acetabular displacement during external rotation stress in the hip

Dominic J L Rivas et al. J Hip Preserv Surg. .

Abstract

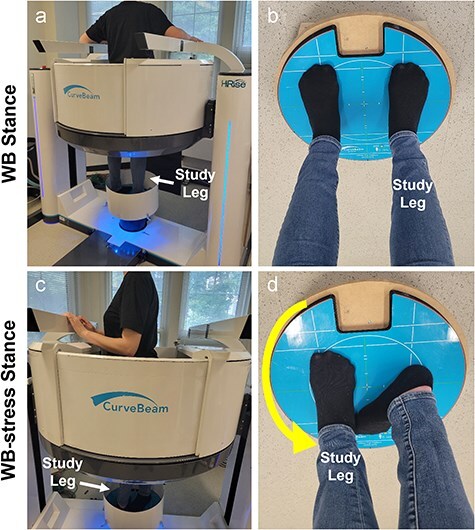
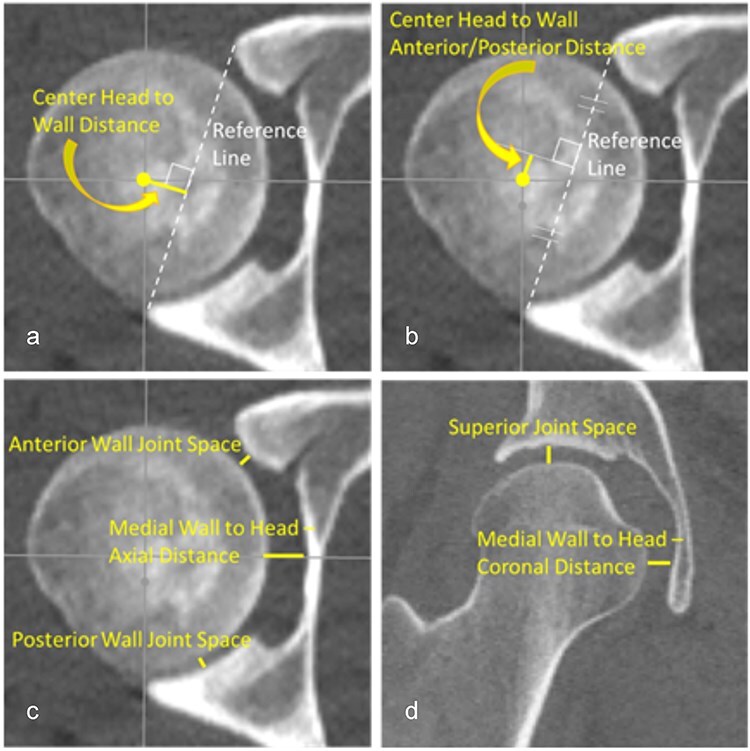
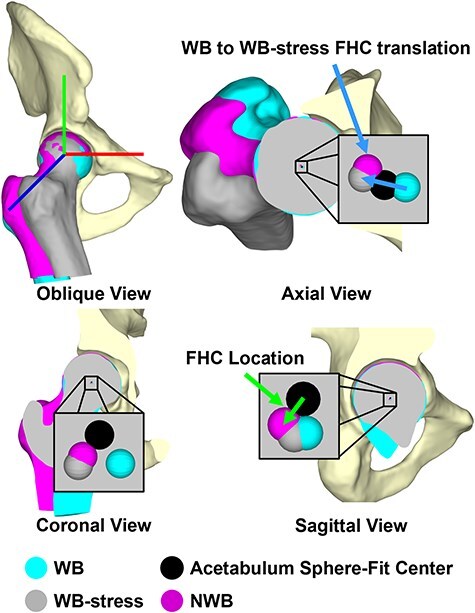
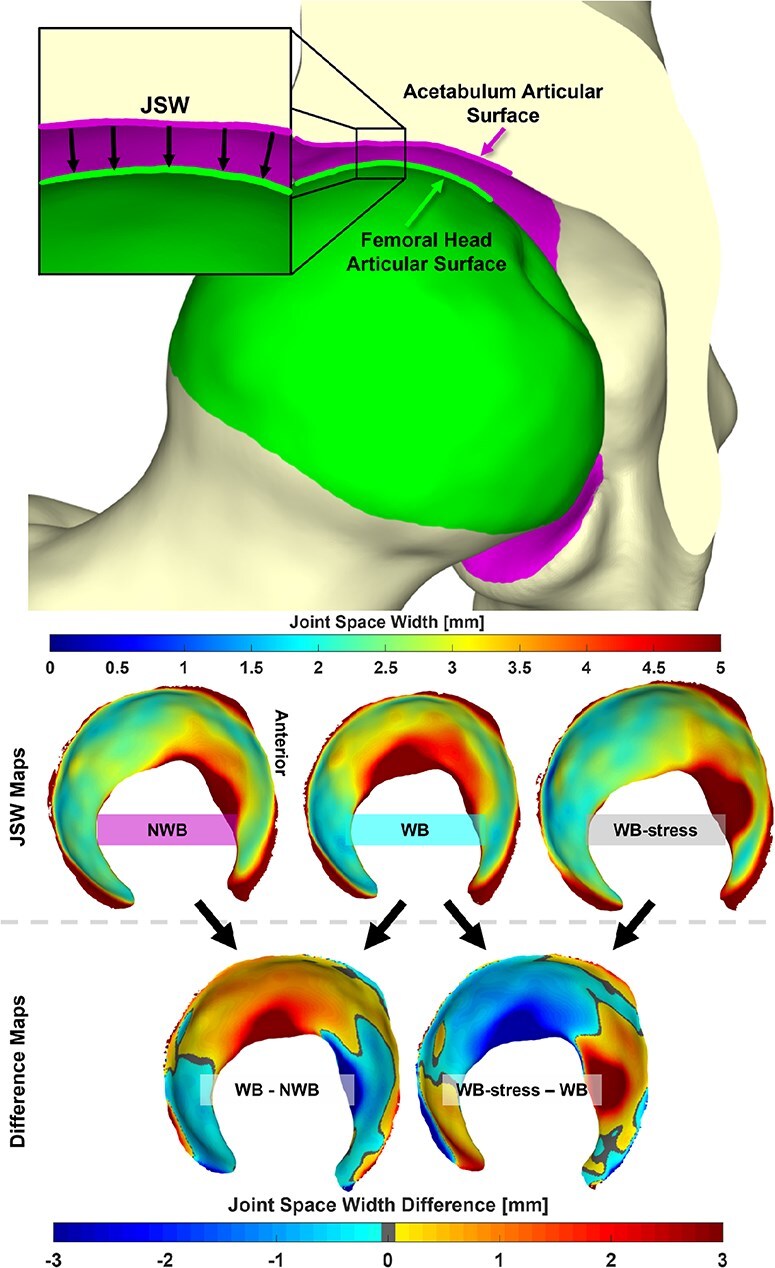
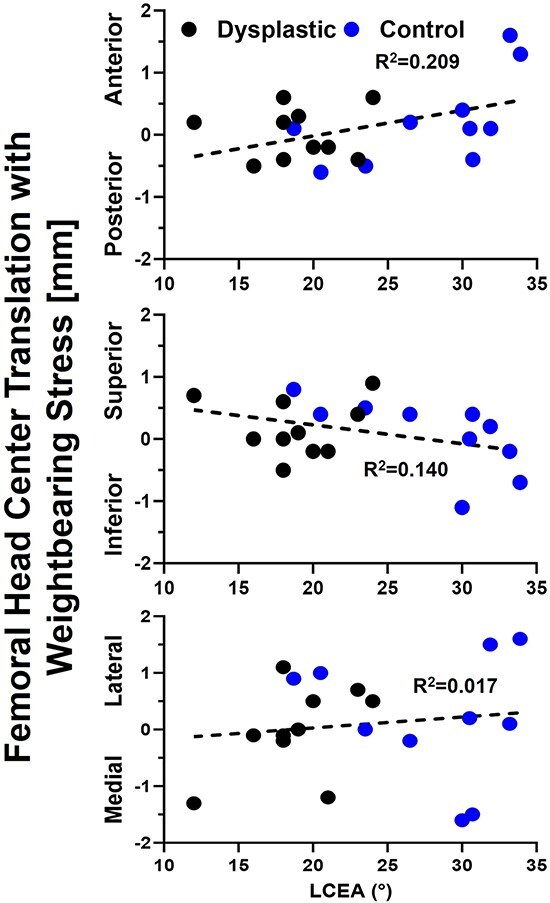
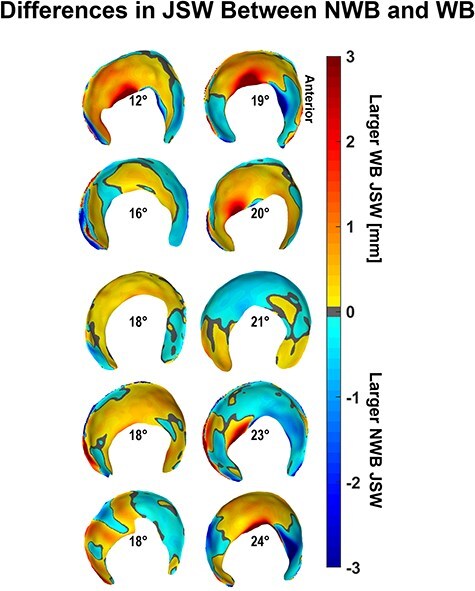
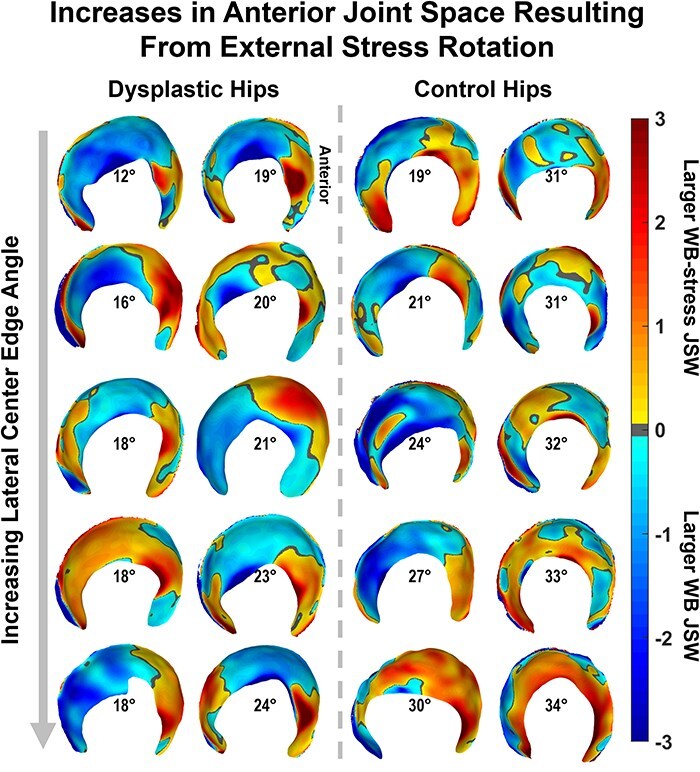
Hip dysplasia causes pathologic joint mechanics and can produce hip instability, leading to progressive joint degeneration and osteoarthritis. Weight-bearing computed tomography (WBCT) is an emerging technology that may enable quantification of femoral-acetabular displacement as an objective indicator of instability. To evaluate this potential, 10 patients indicated for periacetabular osteotomy to treat hip dysplasia and 10 healthy controls underwent two WBCT protocols. Participants were scanned in a neutral stance [weight-bearing (WB)] and again with the hip stressed in maximal external rotation (WB-stress), a position hypothesized to reproduce anterior instability. Clinical, nonweight-bearing computed tomography (CT) scans were available for patients with hip dysplasia. Congruency of the femoroacetabular joint space and position of the femoral head in the acetabulum were quantified via multiple 2D manual measurements and automated 3D measurements. There were no 2D measurements found to differ between the WB and WB-stress scans in either dysplastic (P = .742-1.000) or control (P = .203-1.000) hips. 3D translation of the femoral head center from WB to WB-stress averaged 1.3 ± 0.6 mm in the control hips, compared to 0.9 ± 0.4 mm in the dysplastic hips (P = .096). 3D joint space width (JSW) was determined for both the control and dysplastic hips, with greater JSW found in control hips for both the WB (P = .049) and WB-stress (P = .003) scans. WBCT has the potential to better capture subtle femoral-acetabular displacement derived from both automated 3D and manual 2D measurements in static instability-prone joint orientations.


Conflict of interest statement

No author has any relevant conflict of interests with this work to declare.

Figures

Figure 1.
Figure 1.
(a) Participant standing in the Curvebeam High Rise® weight-bearing CT scanner for the neutral WBCT scan of the hip. (b) Demonstration of the foot position on the foot platform for the neutral (WB) scan. (c) Patient inside the WBCT scanner demonstrating patient-selected maximal external rotation during the stress (WB-stress) scan. (d) The foot on the study leg was shifted to the foot location of the contralateral leg during the neutral scan, and the patient was instructed to rotate their body on the study leg to bring their opposite shoulder as far backward as possible. For this case, the right hip is the study hip, so the left shoulder was rotated back in the scanner (toward the camera/viewer). The participant then brought their contralateral foot back onto the platform behind the foot of the study limb (d) and equalized weight for stability during scanning.
Figure 2.
Figure 2.
A total of seven 2D manual measurements were performed on each CT scan: (a) the distance from the FHC to a line connecting the anterior and posterior rim of the acetabulum, (b) the distance from the FHC to the perpendicular bisector of the rim-to-rim line, (c) the anterior and posterior wall joint space along with the medial wall to head distance in the axial plane, and (d) the superior joint space and the medial wall to head distance in the coronal plane. All measurements were taken on a single axial and a coronal plane image that was verified in three orthogonal imaging planes to pass through the center of the left and right femoral heads.
Figure 3.
Figure 3.
3D Femoral head center location was quantified as the difference in position of the center of a sphere-fit to the articular portion of the femoral head (WB: cyan; NWB: magenta, WB-stress: gray) relative to the center of a sphere-fit to the acetabular lunate (black), while femoral head center translation was calculated as the difference in femoral head center locations [i.e. the external rotation maneuver from WB (cyan) to WB-stress (gray)].
Figure 4.
Figure 4.
(Top) 3D JSW was defined as the projected distance along the normal of each triangular facet comprising the acetabular articular surface toward the femoral head articular surface. (Middle) JSW was calculated for the NWB, WB, and WB-stress positioned geometries. (Bottom) Comparisons of 3D joint space were made between the WB and both the NWB and WB-stress, with difference maps generated for each patient. Anterior is depicted on the right of all joint space maps.
Figure 5.
Figure 5.
Axis-specific femoral head center translation from the neutral to stressed weight-bearing stance was unrelated to lateral coverage with control hip data shown in blue, dysplastic hip data in black, and the linear regression equation relating translation to lateral coverage as the dashed black line.
Figure 6.
Figure 6.
Dysplastic NWB JSW was larger in the anterior subregion and smaller in the medial regions compared to the weight-bearing stance JSW when observed individually rather than collectively, with hips arranged by increasing lateral coverage according to the LCEA shown at the center of each acetabulum.
Figure 7.
Figure 7.
JSW differences from the unstressed to the stressed orientation in the WBCT scanner produced noticeable anterior increases in both cohorts that were not apparent from statistical testing, with both groups (dysplastic: left; control: right) ordered by increasing lateral coverage (LCEA) shown in the center of each acetabulum.

Similar articles

References

    1. Gala L, Clohisy JC, Beaule PE. Hip dysplasia in the young adult. J Bone Joint Surg Am 2016;98:63–73. doi: 10.2106/JBJS.O.00109 - DOI - PubMed
    1. Wells J, Schoenecker P, Duncan S et al. Intermediate-term hip survivorship and patient-reported outcomes of periacetabular osteotomy: The Washington University experience. J Bone Joint Surg Am 2018;100:218–25. doi: 10.2106/JBJS.17.00337 - DOI - PubMed
    1. Wells J, Millis M, Kim Y-J et al. Survivorship of the Bernese periacetabular osteotomy: what factors are associated with long-term failure? Clin Orthop Relat Res 2017;475:396–405. doi: 10.1007/s11999-016-4887-z - DOI - PMC - PubMed
    1. Willey MC, Westermann RW Glass N et al. Risk factors for composite failure of hip dysplasia treated with periacetabular osteotomy: a minimum 10-year follow-up. J Am Acad Orthop Surg 2022;30:e690–e702. - PubMed
    1. Ziran N, Varcadipane J, Kadri O et al. Ten- and 20-year survivorship of the hip after periacetabular osteotomy for acetabular dysplasia. J Am Acad Orthop Surg 2019;27:247–55. doi: 10.5435/JAAOS-D-17-00810 - DOI - PubMed

LinkOut - more resources