. 2025 Jul 29:18:4365-4376.
doi: 10.2147/JMDH.S532383. eCollection 2025.

Relative Fat Mass and Psoriasis Risk: Evidence from NHANES 2009-2014

Affiliations

Relative Fat Mass and Psoriasis Risk: Evidence from NHANES 2009-2014

Tianming Ma et al. J Multidiscip Healthc. .

Abstract

Objective: This study aims to investigate the relationship between Relative Fat Mass (RFM) and the risk of psoriasis based on data from the US National Health and Nutrition Examination Survey (NHANES) from 2009 to 2014.

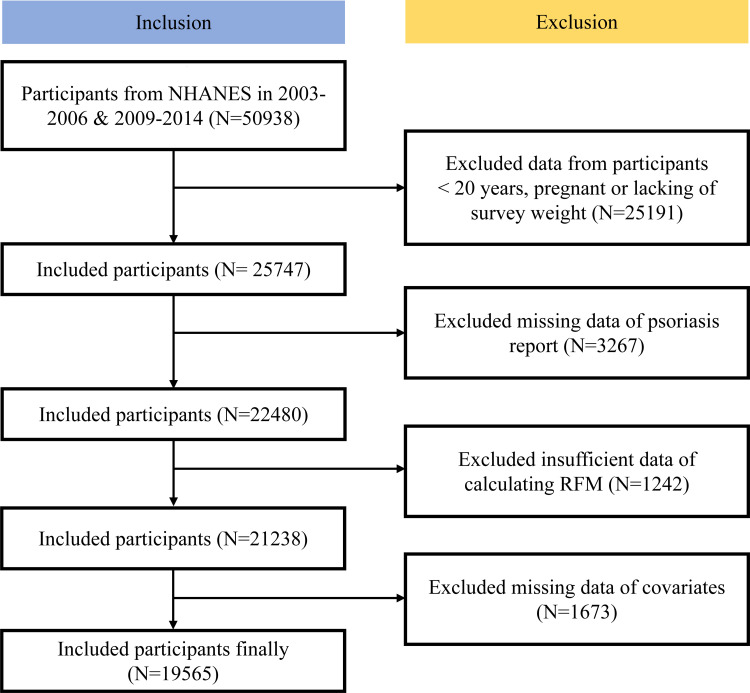
Methods: This cross-sectional study included 19,565 adults aged 20 years and older. Psoriasis diagnosis was determined using self-reported questionnaires, and RFM was calculated based on established formulas. Multivariable logistic regression models were used to analyze the association between RFM and psoriasis risk, adjusting for covariates such as age, gender, race, socioeconomic factors, and health behaviors. Nonlinear relationships and potential threshold effects between RFM and psoriasis were assessed using restricted cubic splines.

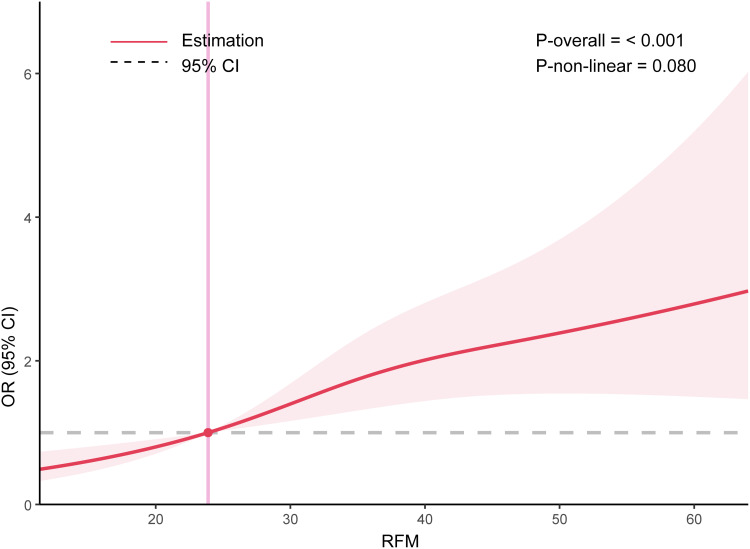
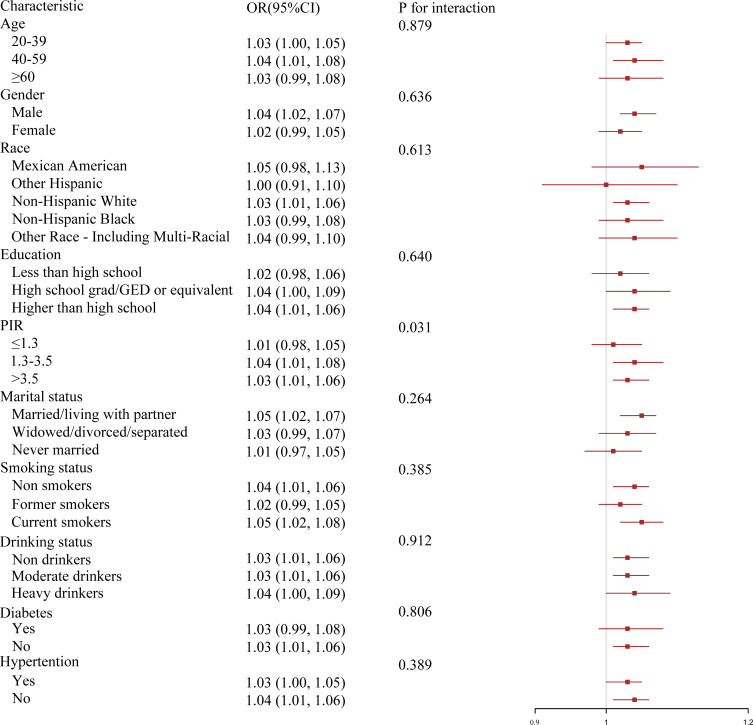
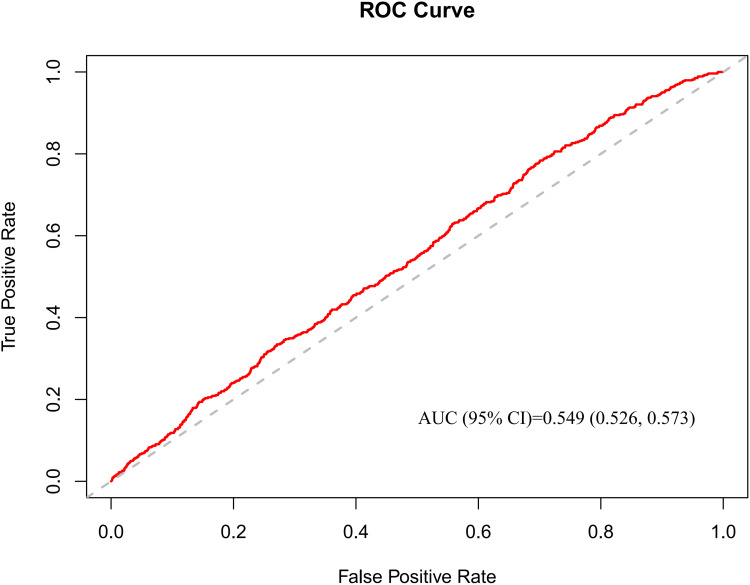
Results: The analysis revealed a significant positive association between RFM and psoriasis risk. Each 1-unit increase in RFM was associated with a 3% higher likelihood of psoriasis (OR=1.03, 95% CI: 1.02-1.05, P<0.05). The restricted cubic spline analysis showed a nonlinear relationship between RFM and psoriasis risk (P_non-linear=0.028). Subgroup analysis further demonstrated that income level (with lower associations observed among those with a poverty-to-income ratio ≤1.3) moderated the relationship. RFM exhibited moderate predictive performance for psoriasis risk, with an area under the receiver operating characteristic curve (AUC) of 0.549.

Conclusion: RFM is significantly associated with increased psoriasis risk, with a dose-response relationship observed. These findings suggest that RFM may serve as a useful predictor for psoriasis risk and could be incorporated into screening strategies for early detection and prevention.

Keywords: NHANES; cross-sectional study; obesity; psoriasis; relative fat mass.


Conflict of interest statement

Tianming Ma, Xiaoqing Xiang, Guijun Liu declare no competing interest.

Figures

Figure 1
Figure 1
Participant Flowchart of Study Inclusion (NHANES 2003–2014). This study utilized data from the National Health and Nutrition Examination Survey (NHANES) 2003–2006 and 2009–2014 cycles. From an initial pool of 50,938 participants, stepwise exclusions (age <20 years, pregnancy, missing key variables) yielded a final analytical cohort of 19,565 eligible participants. The flowchart details sequential inclusion/exclusion criteria and attrition causes.
Figure 2
Figure 2
Restricted cubic spline (RCS) curve of the association between relative fat mass (RFM) and psoriasis among all participants. The red solid line indicates the estimated odds ratios (ORs) for psoriasis across the spectrum of RFM, with the red shaded area representing the 95% confidence intervals (CIs). The gray dashed horizontal line represents the null value (OR = 1.0), and the vertical pink line marks the reference RFM value. The association between RFM and psoriasis was statistically significant overall (P-overall < 0.001), with a marginally significant non-linear trend (P-non-linear = 0.080).
Figure 3
Figure 3
Subgroup analyses of the associations between relative fat mass (RFM) and psoriasis. This forest plot displays the odds ratios (ORs) and 95% confidence intervals (CIs) for the association between RFM and psoriasis across different subgroups. Subgroups include age, gender, race, education, poverty income ratio (PIR), marital status, smoking status, drinking status, diabetes, and hypertension. P values for interaction were calculated to assess effect modification. A statistically significant interaction was observed for PIR (P = 0.031), suggesting heterogeneity in the association across PIR levels.
Figure 4
Figure 4
Receiver operating characteristic (ROC) curve evaluating the predictive performance of RFM for psoriasis. The ROC curve (red line) illustrates the trade-off between sensitivity and specificity of RFM in predicting psoriasis. The area under the curve (AUC) was 0.549 (95% CI: 0.526–0.573), indicating poor discriminatory ability. The gray dashed diagonal line represents a non-informative classifier (AUC = 0.5).

Similar articles

References

    1. Jain R, Sangoi R, Pascal S, et al. Insights Into the Epidemiological, Clinical, Histopathological, and Dermoscopic Aspects of Chronic Plaque Psoriasis. Cureus. 2024;16(9):e69912. PMID: 39439643; PMCID: PMC11495829. doi: 10.7759/cureus.69912. - DOI - PMC - PubMed
    1. Gao Y, Xu T, Wang Y, et al. Pathophysiology and Treatment of Psoriasis: from Clinical Practice to Basic Research. Pharmaceutics. 2025;17(1):56. PMID: 39861704; PMCID: PMC11769081. doi: 10.3390/pharmaceutics17010056. - DOI - PMC - PubMed
    1. Yi RC, Akbik M, Smith LR, Klionsky Y, Feldman SR. Therapeutic Advancements in Psoriasis and Psoriatic Arthritis. J Clin Med. 2025;14(4):1312. PMID: 40004842; PMCID: PMC11855982. doi: 10.3390/jcm14041312. - DOI - PMC - PubMed
    1. Kunz M, Simon JC, Saalbach A. Psoriasis: obesity and Fatty Acids. Front Immunol. 2019;10:1807. PMID: 31417571; PMCID: PMC6684944. doi: 10.3389/fimmu.2019.01807. - DOI - PMC - PubMed
    1. Han JH, Lee JH, Han KD, et al. Increased risk of psoriasis in subjects with abdominal obesity: a nationwide population-based study. J Dermatol. 2019;46(8):695–701. Epub 2019 May 31. PMID: 31149744. doi: 10.1111/1346-8138.14939. - DOI - PubMed

LinkOut - more resources