. 2025 Jul 21:7:1619238.
doi: 10.3389/fmedt.2025.1619238. eCollection 2025.

New insights in fluid monitoring for surgical patients. A concept study

Affiliations

New insights in fluid monitoring for surgical patients. A concept study

Audrius Andrijauskas et al. Front Med Technol. .

Abstract

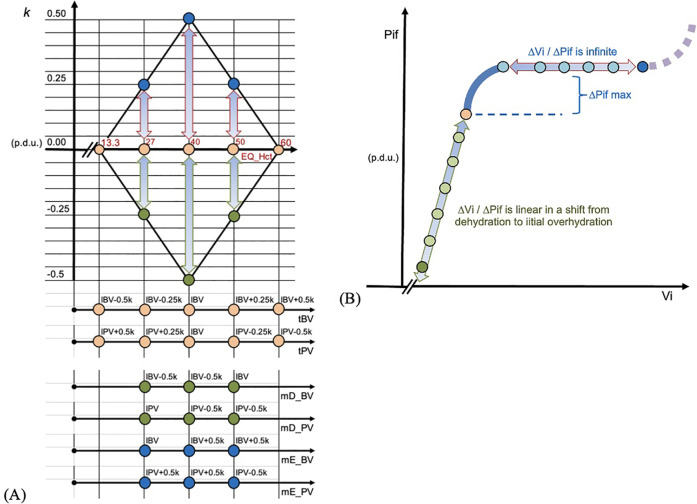
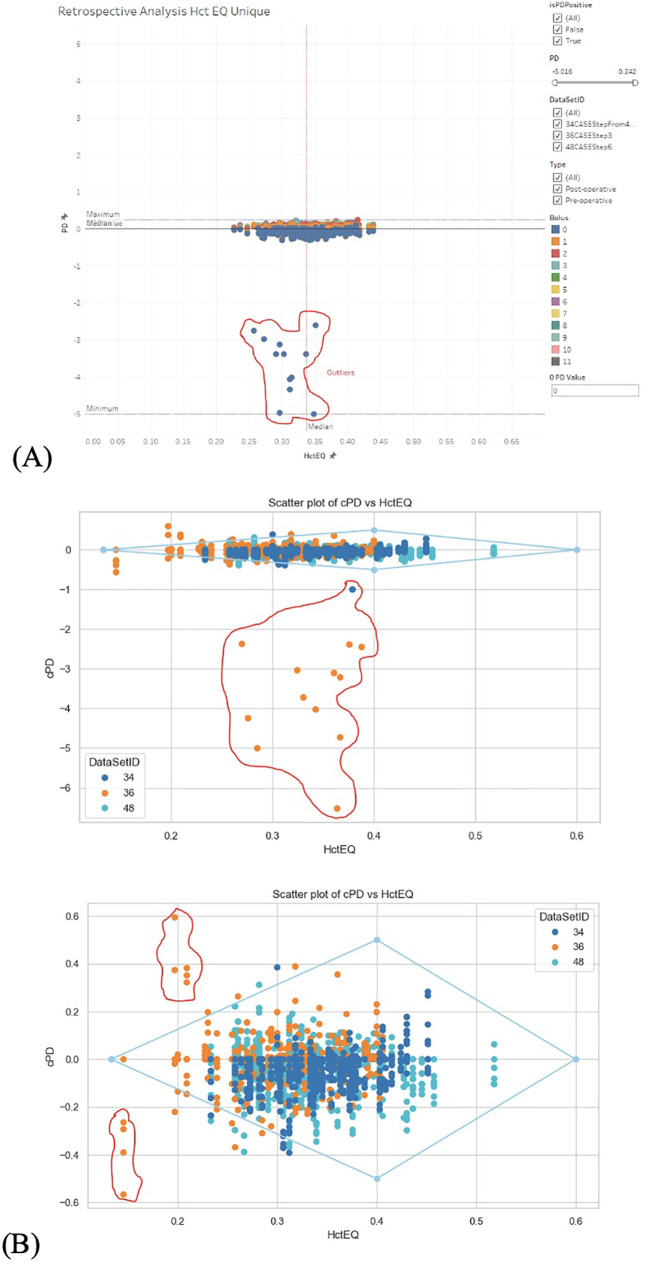
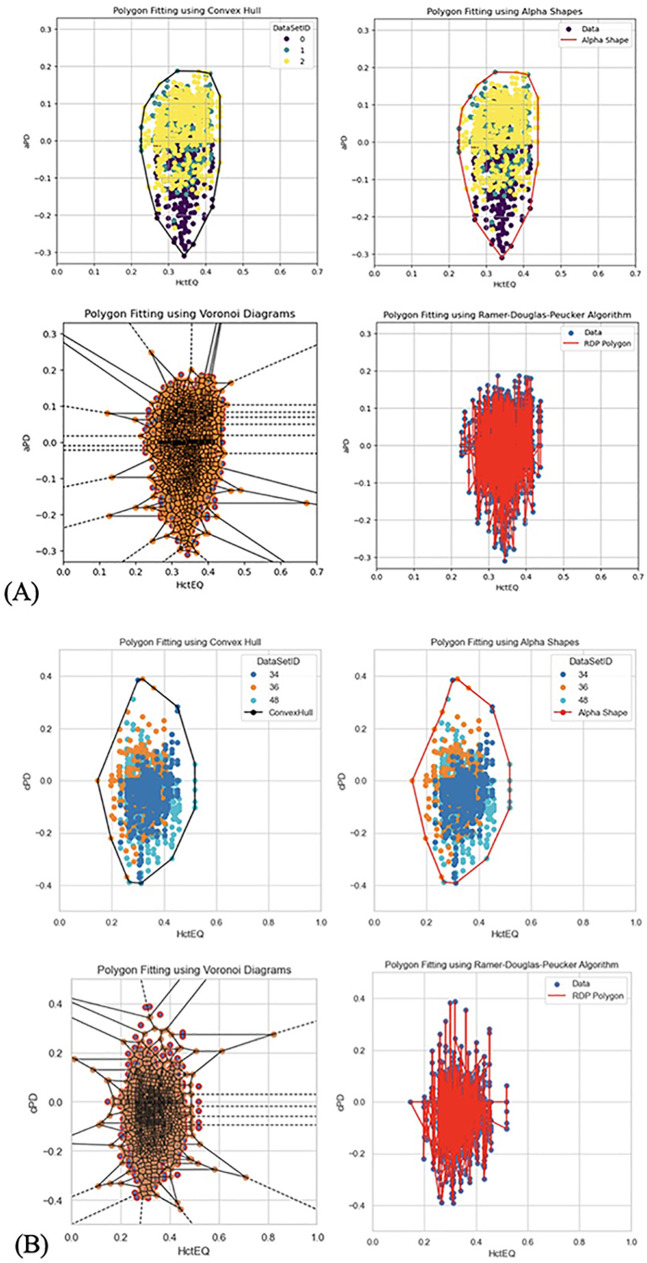
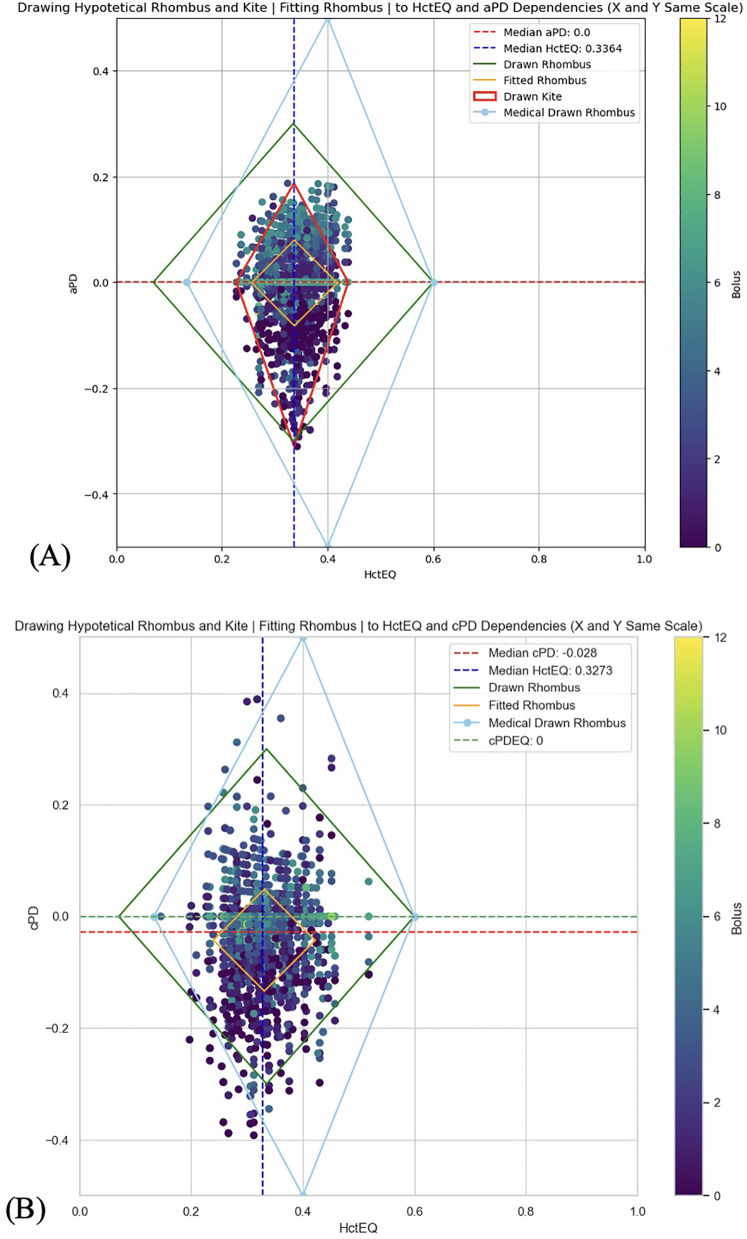
Purpose: This study evaluates the primary hypothesis of red cell mass (RCM) dependent amplitude of homeostatically acceptable limits of fluctuation in plasma dilution by exploring the correlation between RCM-specific equilibrated hematocrit (EQ_Hct) and amplitude of plasma dilution during perioperative mini Volume Loading Test (mVLT).

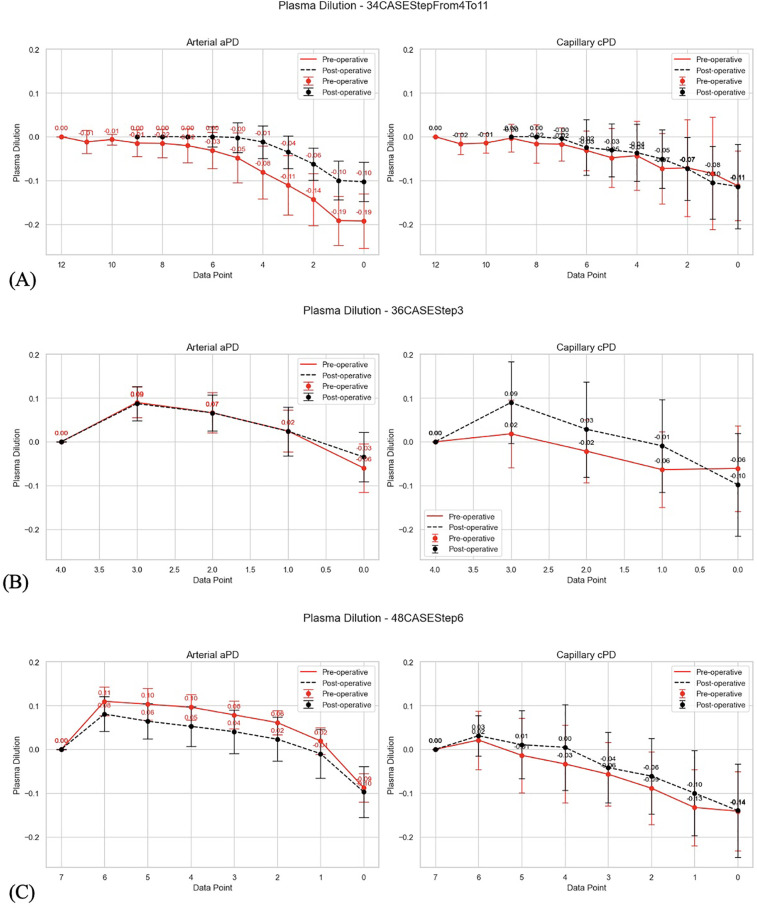
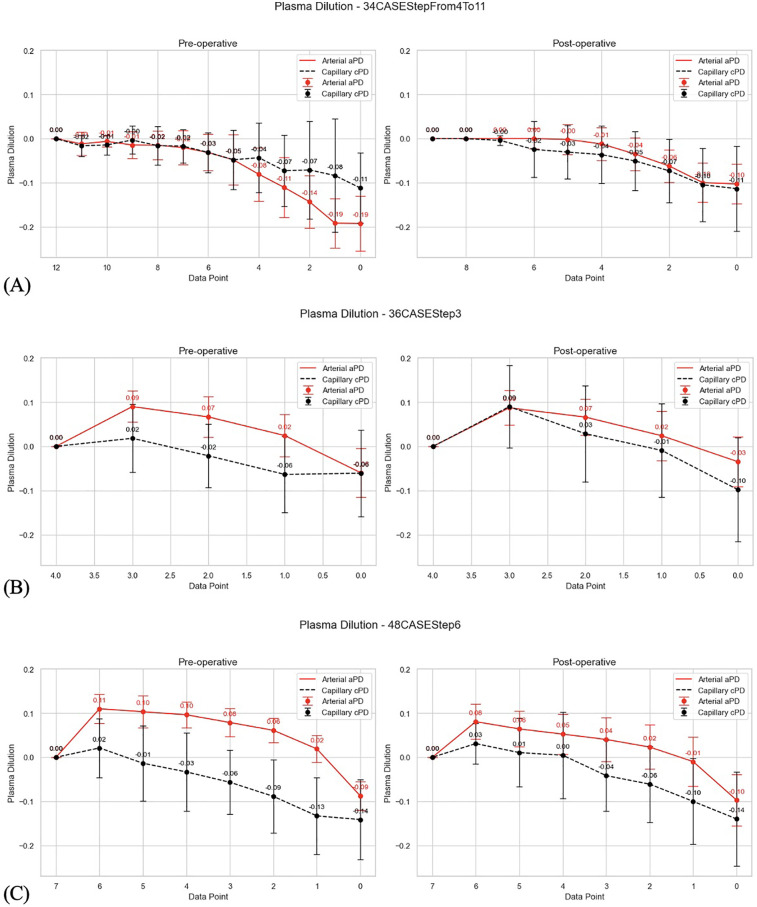
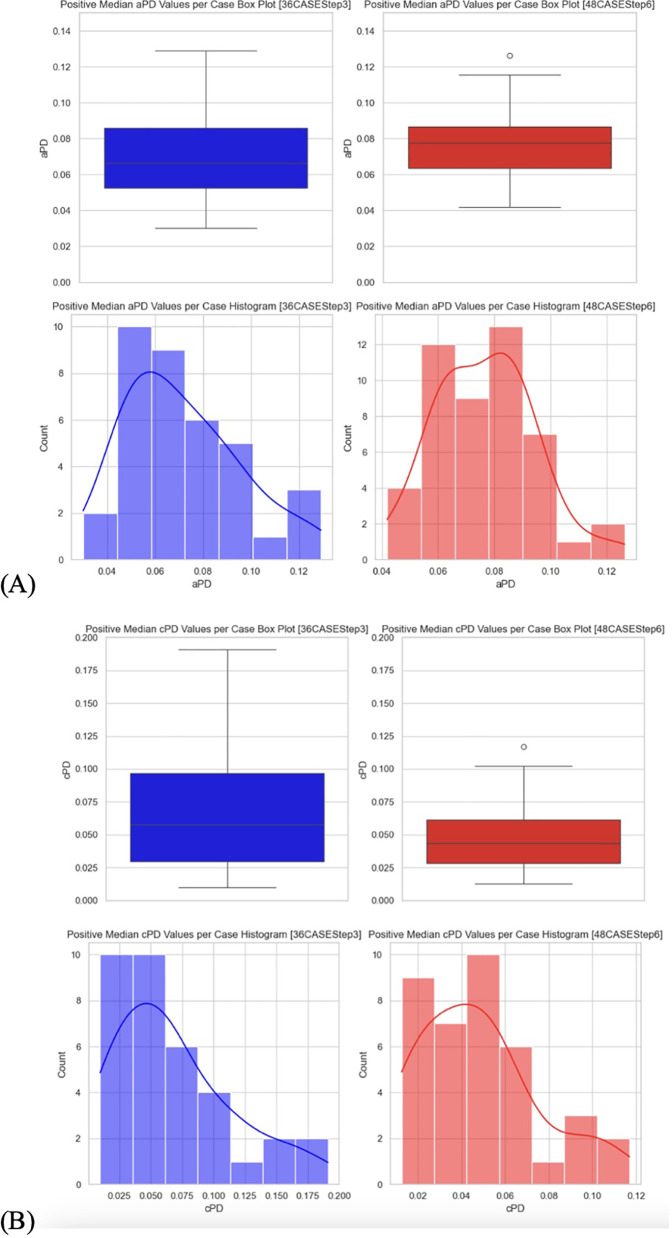
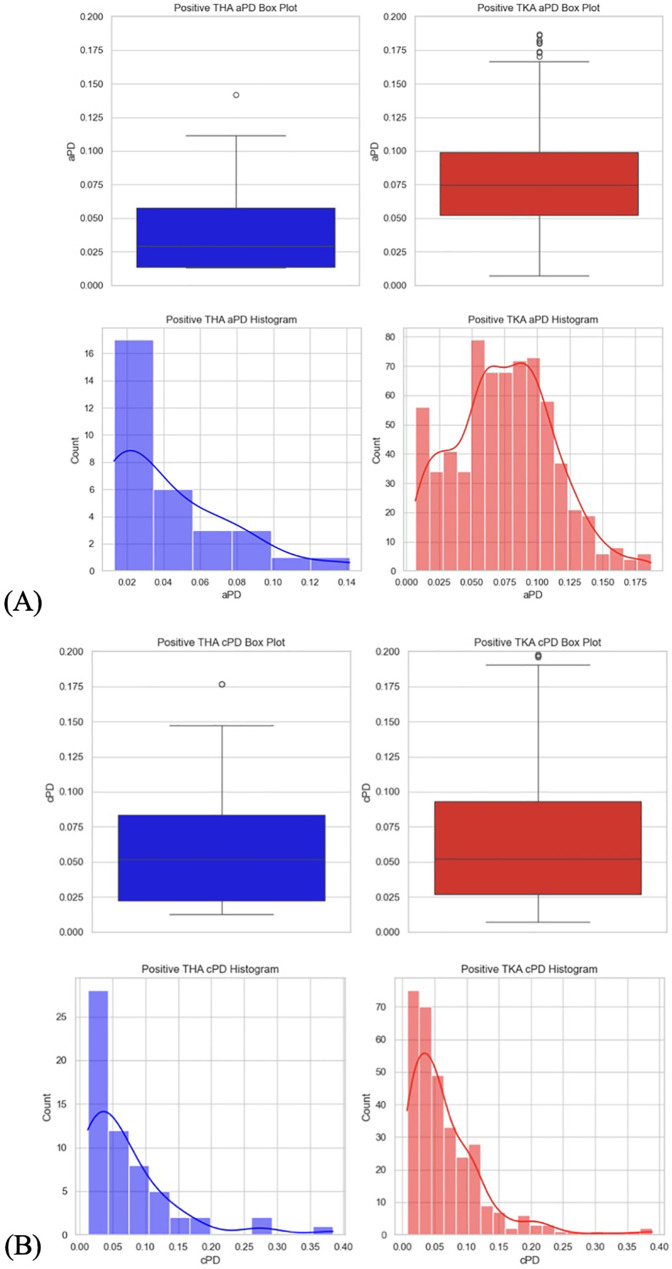
Materials and methods: We retrospectively analyzed data from our previous RCTs, including 1,651 invasive arterial plasma dilution (aPD), 1,645 noninvasive "capillary" plasma dilution (cPD) and 236 estimates of EQ_Hct from 236 perioperative mVLT sessions. The cPD was estimated using noninvasive hemoglobin (SpHb, Masimo Radical 7, Irvine, CA) measurement. Fixed number of crystalloid boluses was used in 36 and 48 elective total knee arthroplasty (TKA) patients, and individualized number of boluses in 34 total hip arthroplasty (THA) patients for whom the number of boluses depended on the advices by our prototype automated clinical decision support system (ACDSS).

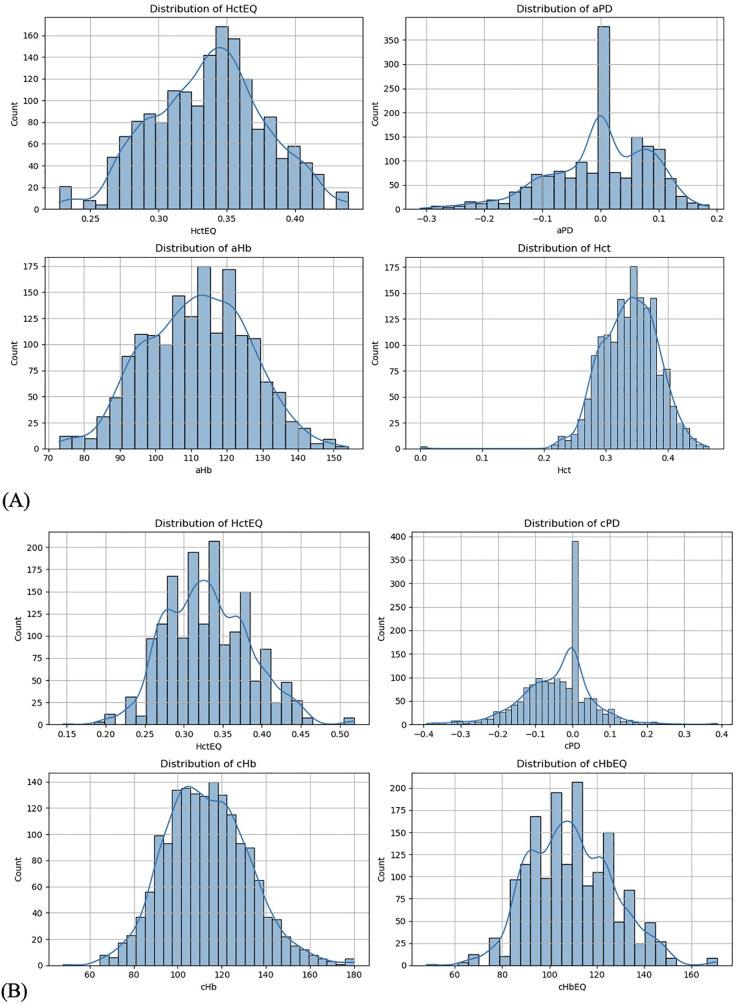
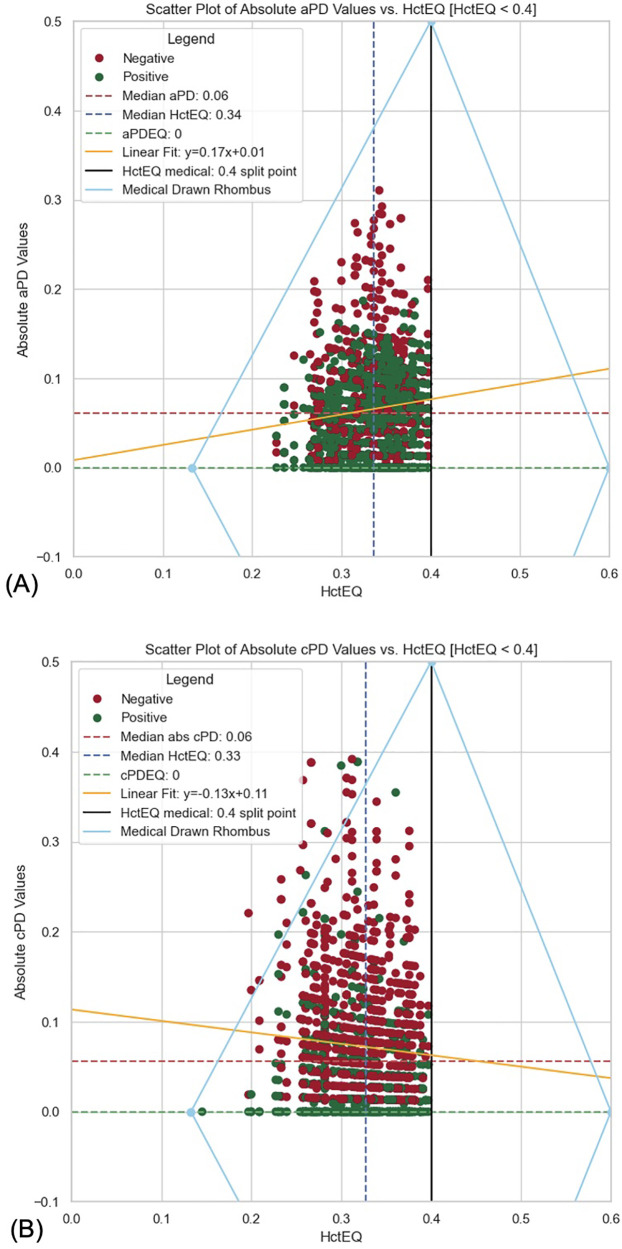
Results: The primary hypothesis was confirmed-aPD decreased as EQ_Hct decreased when EQ_Hct <40%, and a very weak positive correlation was found between EQ_Hct and absolute aPD (Spearman's correlation coefficient 0.1025, p < 0.001). It was also confirmed when non-invasive data sets were used. A very weak negative correlation between HctEQ values and absolute cPD values (Spearman's correlation coefficient 0.0640, p = 0.0149).

Conclusion: This study points to the feasibility of Photoplethysmography (PPG) based estimates of hemoglobin concentration for continuous noninvasive monitoring of fluid accumulation and detecting imminent edema using the Homeostatic Blood States (HBS) theory and transcapillary reflux model. The ACDSS-guided fluid loading has a potential to minimise unnecessary fluid accumulation. Further research is needed to explore and improve these techniques.

Keywords: hematocrit; hemodilution; hemoglobin; hydration; innovative technique; perioperative fluid therapy; plasma dilution; transcapillary reflux.


Conflict of interest statement

The authors declare that the research was conducted in the absence of any commercial or financial relationships that could be construed as a potential conflict of interest. The author(s) declared that they were an editorial board member of Frontiers, at the time of submission. This had no impact on the peer review process and the final decision.

Figures

Figure 1
Figure 1
(A) EQ_Hct in our report refers to homeostatic target hematocrit (tHct) in HBS theory. EQ_Hct 13.3% refers to the Upper Hemodilution Limit (plasma dilution) in HBS theory. EQ_Hct 40% ITM is hematocrit at the Ideal Total Match, a unique combination of estimated ideal blood volume (IBV) and ideal plasma volume (IPV). EQ_Hct 50.0% refers to the Lower Hemodilution Limit (plasma concentration). The rhombus shape limits depict the red cell mass (RCM) dependent homeostatically acceptable limits of plasma dilution for a given EQ_Hct (where each EQ_Hct value corresponds to a unique red cell mass value); limits are based on the rule that neither blood volume, nor plasma volume cannot overcome the deviation from their estimated ideal values—IBV and IPV—by more than 0.5 k, where k is coefficient used in HBS math for estimating relevant data. mD_BV and mD_PV are values at the level of critical dehydration; mE_BV and mE_PV are values at the level of critical overhydration; Homoestatically safe upper plasma dilution limit is at EQ_Hct; to this state homeostasis strives to return soonest after this limit is overcome. (B) Ratio interstitial fluid volume (Vi) to interstitial fluid pressure (Pif) is interstitial fluid compliance. When it starts increasing (heavy blue curve), the maximal counterpressure to increased fluid filtration into tissues is reached; it facilitates reduction of interstitial fluid, e.g., via lymph. Theoretically, at that point homeostasis facilitates elimination of fluid from plasma so that excessive fluid is not shifting into tissues. It was assumed as happening during equilibration period of mVLT in our study. When the overwhelming fluid is entering tissues, e.g., capillary leak, compliance becomes infinite and fluids are accumulating easily in tissues. In extremes compliance starts decreasing and its life threatening edema condition.
Figure 2
Figure 2
(A) Visualized differences between pre-operative and post-operative changes in arterial and capillary PD in perioperative mVLT sessions in 34 THA patients; reverse plasma dilution trends imply PD_EQ (first data point from the left) as baseline for estimates of PD during stepwise infusion; the PD which is before the first bolus (data point 0.0) is thus at the end of plasma concentration trend. (B) Visualized differences between pre-operative and post-operative changes in arterial and capillary PD in perioperative mVLT sessions in 36 TKA patients; reverse plasma dilution trends imply PD_EQ (first data point from the left) as baseline for estimates of PD during stepwise infusion; the PD which is before the first bolus (data point 0.0) is thus at the end of plasma concentration trend. (C) Visualized differences between pre-operative and post-operative changes in arterial and capillary PD in perioperative mVLT sessions in 48 TKA patients; reverse plasma dilution trends imply PD_EQ (first data point from the left) as baseline for estimates of PD during stepwise infusion; the PD which is before the first bolus (data point 0.0) is thus at the end of plasma concentration trend.
Figure 3
Figure 3
(A) Visualized differences between arterial and capillary PD. 34 THA patients; reverse plasma dilution trends imply PD_EQ (first data point from the left) as baseline for estimates of PD during stepwise infusion; the PD which is before the first bolus (data point 0.0) is thus at the end of plasma concentration trend. (B) Visualized differences between arterial and capillary PD.) 36 TKA patients; reverse plasma dilution trends imply PD_EQ (first data point from the left) as baseline for estimates of PD during stepwise infusion; the PD which is before the first bolus (data point 0.0) is thus at the end of plasma concentration trend. (C) Visualized differences between arterial and capillary PD. 48 TKA patients; reverse plasma dilution trends imply PD_EQ (first data point from the left) as baseline for estimates of PD during stepwise infusion; the PD which is before the first bolus (data point 0.0) is thus at the end of plasma concentration trend.
Figure 4
Figure 4
(A) Data distribution from arterial data set. (B) Data distribution from SpHb data set.
Figure 5
Figure 5
(A) Cleaning outliers in aPD_EQ data set. Step 1 and step 2. (B) Cleaning outliers in cPD_EQ data set. Step 1 and step 2.
Figure 6
Figure 6
(A) Different methods to fit polygons in aPD_EQ data set. (B) Different methods to fit polygons in cPD_EQ data set.
Figure 7
Figure 7
(A) A rhombus fitting method to assess the data distribution and its statistical relevance to follow rhombus shape (yellow line) for testing the theoretical red cell mass dependent limits of homeostatic plasma dilution. aPD_EQ data sets were fit to the HBS theory's “Rhombus” (light blue color; tHct range is from 13.3% to 60%. Maximal amplitude of PDA is at tHct 40%, and none at tHct 13.3% and 60%); (see Figure 1). (B) A rhombus fitting method to assess the data distribution and its statistical relevance to follow rhombus shape (yellow line) for testing the theoretical red cell mass dependent limits of homeostatic plasma dilution. cPD_EQ data sets were fit to the HBS theory's “Rhombus” (light blue color; tHct range is from 13.3% to 60%. Maximal amplitude of PDA is at tHct 40%, and none at tHct 13.3% and 60%); (see Figure 1).
Figure 8
Figure 8
(A) Scatter plot of absolute aPD values vs. HctEQ [HctEQ < 0.4]. (B) Scatter plot of absolute cPD values vs. HctEQ [HctEQ < 0.4].
Figure 9
Figure 9
(A) Positive median PD values per case box plot and histograms. Positive median aPD values. (B) Positive median PD values per case box plot and histograms. Positive median cPD values.
Figure 10
Figure 10
(A) Positive PD values per THA and TKA data sets box plot and histograms. Positive aPD values. (B) Positive PD values per THA and TKA data sets box plot and histograms. Positive cPD values.

Similar articles

References

    1. Miller TE, Mythen M, Shaw AD, Hwang S, Shenoy AV, Bershad M, et al. Association between perioperative fluid management and patient outcomes: a multicentre retrospective study. Br J Anaesth. (2021) 126(3):720–9. 10.1016/j.bja.2020.10.031 - DOI - PubMed
    1. Vandenberghe W, De Loor J, Hoste EAJ. Diagnosis of cardiac surgery-associated acute kidney injury from functional to damage biomarkers. Curr Opin Anaesthesiol. (2017) 30(1):66–75. 10.1097/ACO.0000000000000419 - DOI - PubMed
    1. Törnudd M, Hahn RG, Zdolsek JH. Fluid distribution kinetics during cardiopulmonary bypass. Clinics (Sao Paulo). (2014) 69(8):535–41. 10.6061/clinics/2014(08)06 - DOI - PMC - PubMed
    1. Hahn RG. Understanding volume kinetics. Acta Anaesthesiol Scand. (2020) 64(5):570–8. 10.1111/aas.13533 - DOI - PubMed
    1. Hahn RG. Clinical Fluid Therapy in the Perioperative Setting. 2 ed. Cambridge: Cambridge University Press; (2016).

LinkOut - more resources